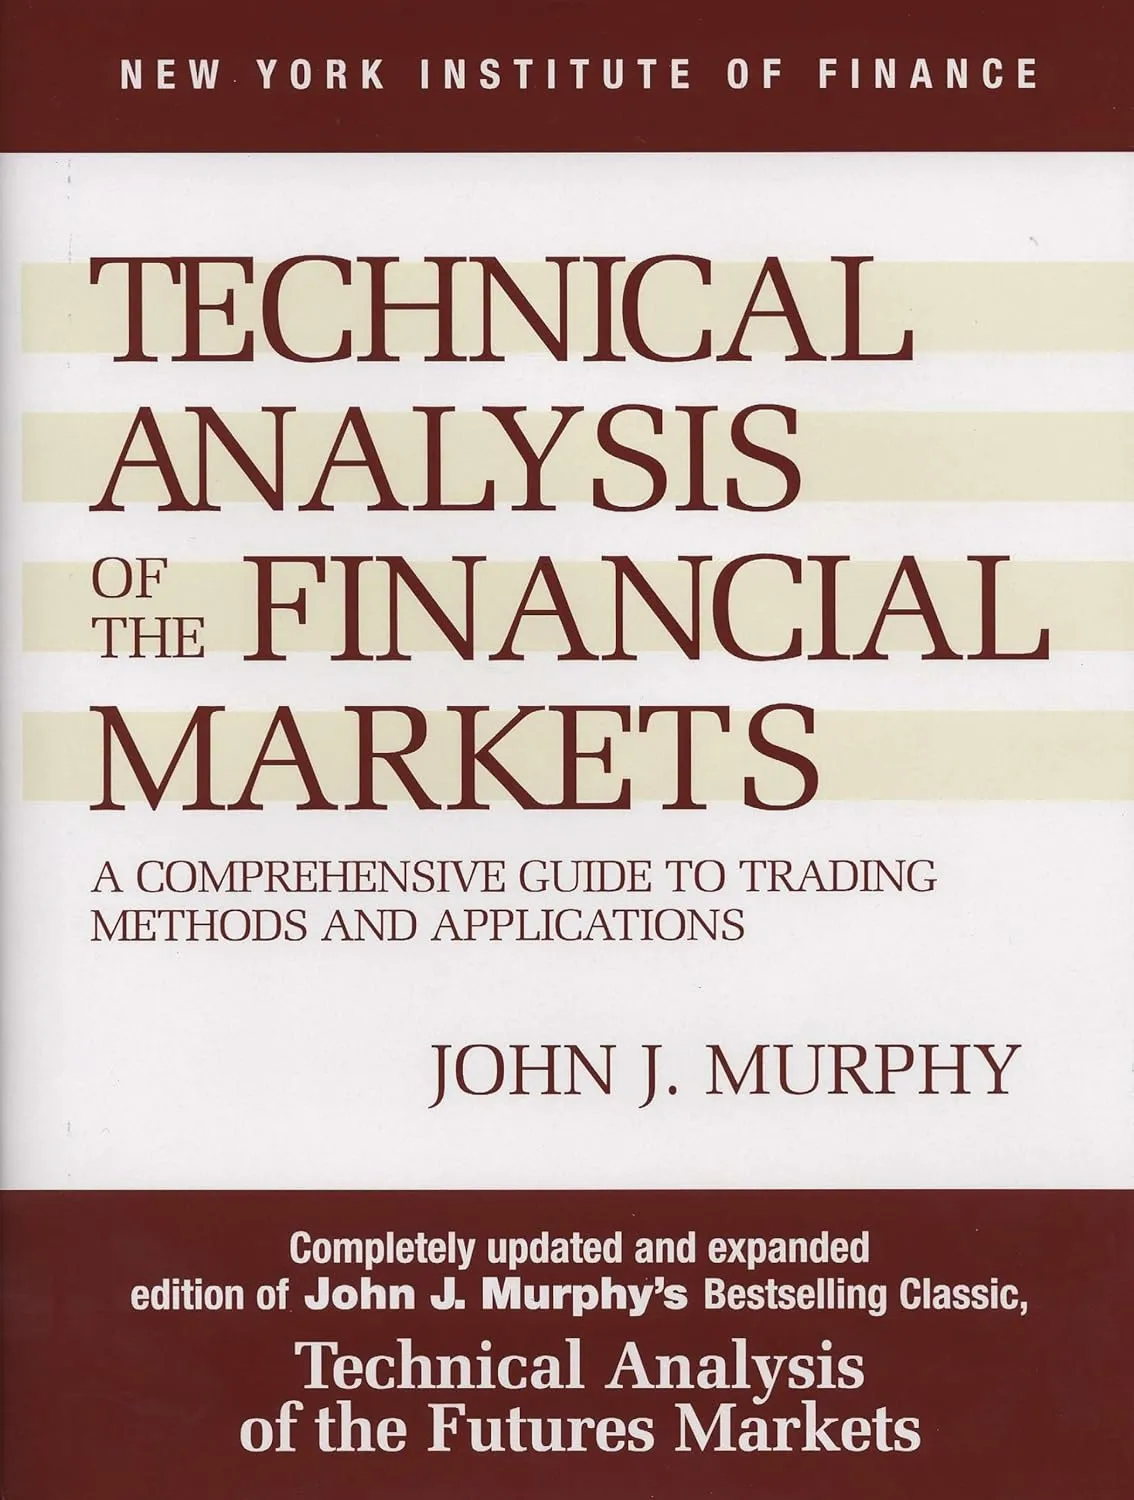
Technical Analysis
Quick Definition
Technical analysis is the practice of evaluating stocks by analyzing price movements, trading volume, and chart patterns to identify trends and potential turning points. Instead of asking what a company is worth, technical analysis asks what the price is doing and where it is likely to go next based on historical patterns in the price data itself.
What It Means
Technical analysts believe that all known information about a stock, including fundamentals, news, and sentiment, is already reflected in the current price. Rather than studying earnings reports and balance sheets, they study the price chart. The price is the output of millions of investors making decisions based on all available information. By reading the price action, you are reading the collective wisdom of the market.
This approach stands in contrast to fundamental analysis, which estimates intrinsic value by studying the company. Fundamental analysts ask "what is this business worth?" Technical analysts ask "where is this price going?" Many professional traders use both: fundamentals to decide what to buy, technicals to decide when to buy and sell.
Technical analysis operates on three core assumptions. First, the market discounts everything. All information is already in the price. Second, prices move in trends. Once a trend is established, it is more likely to continue than to reverse. Third, history repeats itself. Patterns that worked in the past will work in the future because human psychology does not change. Fear and greed drive the same chart patterns today that they drove 100 years ago.
The 2026 market has provided a rich environment for technical analysis. Through July and August 2026, the major indexes have shown distinct technical patterns. The S&P 500 declined a modest 0.1% in July 2026 while the Russell 1000 Value Index gained 3.8% and its growth counterpart lost 4.8%, an 860 basis point spread. Approximately 64% of S&P 500 stocks remained above their 50-day moving averages and 69% above their 200-day moving averages as of late August 2026, readings that technical analysts classify as constructive but not overbought. The Nasdaq showed weaker breadth, with 53% above the 50-day and 67% above the 200-day.
On August 5, 2026, the S&P 500 did something rare: it closed an entire session above the upper Bollinger Band with a 5-day RSI above 75. This combination has occurred only 62 times since 2000, and historical analysis shows these setups lead to meager returns at best because extreme momentum often precedes exhaustion.
How It Works
Chart Types
Technical analysts use several chart types to visualize price data:
Line charts connect closing prices with a single line. Simple and clean, they show the overall trend without noise.
Bar charts show the open, high, low, and close (OHLC) for each period. The vertical line shows the high-low range, and small horizontal ticks show the open and close.
Candlestick charts are the most popular. Each candle shows the open, high, low, and close. The body is filled (red or black) if the close was below the open, and hollow (green or white) if the close was above. Candlestick patterns like doji (indecision), hammer (reversal), and engulfing (trend change) signal potential shifts in sentiment.
Key Indicators
Technical analysts use dozens of indicators. Here are the most widely used:
| Indicator | What It Measures | How Traders Use It |
|---|---|---|
| Moving average (MA) | Average price over a period (50-day, 200-day) | Trend direction. Price above rising MA = uptrend |
| RSI (Relative Strength Index) | Momentum on a 0 to 100 scale | Overbought above 70, oversold below 30 |
| MACD | Relationship between two exponential MAs | Crossovers signal trend changes |
| Bollinger Bands | Volatility bands around a 20-day MA | Price touching upper band = overbought |
| Volume | Number of shares traded | Confirms or contradicts price moves |
| Support and resistance | Price levels where buying or selling emerges | Buy at support, sell at resistance |
| Fibonacci retracements | Key retracement levels (38.2%, 50%, 61.8%) | Potential reversal points in a trend |
The 50-Day and 200-Day Moving Averages
The 50-day and 200-day moving averages are the most watched indicators in technical analysis. The 200-day MA is the dividing line between a bull and bear market for many traders. When the S&P 500 is above its 200-day MA, the primary trend is bullish. When it falls below, the trend has turned bearish.
The "golden cross" occurs when the 50-day MA crosses above the 200-day MA, a bullish signal. The "death cross" is the opposite, when the 50-day falls below the 200-day, a bearish signal. As of August 2026, approximately 69% of S&P 500 stocks trade above their 200-day moving averages, a reading that technical analysts consider constructive for the primary trend.
Support and Resistance
Support is a price level where buying interest is strong enough to overcome selling pressure, preventing the price from falling further. Resistance is the opposite: a level where selling pressure overcomes buying, capping the price. These levels are not magic lines. They represent the price points where large numbers of investors previously bought or sold and have emotional or financial reasons to act again.
When a stock breaks through resistance, that level often becomes new support. When a stock falls through support, that level becomes new resistance. This "role reversal" is one of the most reliable patterns in technical analysis.
Divergence
Divergence occurs when price and an indicator move in opposite directions. A bullish divergence happens when price makes lower lows but RSI makes higher lows, signaling that downward momentum is weakening even though the price is still falling. A bearish divergence happens when price makes higher highs but RSI makes lower highs, signaling that upward momentum is fading.
Divergence is one of the most powerful technical signals because it can warn of a trend change before it appears in the price. In 2026, divergence trading has been particularly effective for identifying reversals in volatile tech stocks where momentum shifts happen quickly.
Real-World Examples
The August 2026 S&P 500 Technical Picture
As of late August 2026, the technical picture for U.S. indexes shows a market in a rotational correction within a primary bull trend:
| Index | Phase | Key Technical Reading |
|---|---|---|
| SPY (S&P 500) | Bullish | Above 50-day and 200-day MA |
| QQQ (Nasdaq 100) | Warning | Near or below 50-day MA, above 200-day |
| IWM (Russell 2000) | Bullish | Above 50-day and 200-day MA |
| DIA (Dow Jones) | Bullish | Above 50-day and 200-day MA |
The weekly charts remain bullish across all indexes, with prices above rising moving averages. The smoothed breadth readings are constructive: 61%, 64%, and 69% of S&P stocks are above their 20-day, 50-day, and 200-day moving averages respectively. These are not bear-market readings. However, daily NYSE and Nasdaq up/down volume ratios weakened in August, and McClellan Oscillators slipped below neutral, suggesting short-term softness within a longer-term uptrend.
The Bollinger Band Signal
On August 5, 2026, the S&P 500 closed above its upper Bollinger Band with a 5-day RSI above 75. This is a rare technical event, occurring only 62 times since 2000. Historical analysis of these occurrences shows that extreme momentum readings often precede exhaustion rather than continuation. The McClellan Oscillator, a measure of market breadth, sat at neutral levels at the same time, meaning the rally lacked broad participation. A rally without broad participation is vulnerable to reversal, which is exactly what technical analysts would predict from this signal.
A Practical Trade Setup
A swing trader identifies a stock in an uptrend (price above rising 50-day MA) that has pulled back to support at its 200-day MA. RSI has dropped to 35, approaching oversold. Volume on the pullback has been below average, suggesting weak selling pressure. The trader buys near the 200-day MA with a stop loss just below support and a target at the recent highs.
This setup combines three technical signals: trend (rising 50-day MA), support (200-day MA), and momentum (RSI approaching oversold). No single signal is reliable, but when multiple signals align, the probability of a successful trade increases.
Key Points to Remember
- Technical analysis studies price action, volume, and chart patterns rather than company fundamentals
- The three core assumptions: the market discounts everything, prices move in trends, and history repeats
- The 200-day moving average is the dividing line between bull and bear markets for many traders
- Support and resistance levels represent price points where large numbers of investors previously acted
- Divergence between price and momentum indicators can signal trend changes before they appear in price
- As of August 2026, 69% of S&P 500 stocks trade above their 200-day MA, a constructive reading
- Technical analysis works best for timing entries and exits, not for determining what to buy
Common Mistakes to Avoid
- Using too many indicators. Beginners often stack 10 indicators on a chart and get conflicting signals from each. Pick two or three indicators that measure different things (trend, momentum, volume) and learn them thoroughly. More indicators do not mean better analysis. They mean more confusion.
- Ignoring the timeframe. A bullish signal on a 5-minute chart means nothing if you are investing with a 5-year horizon. Match your technical analysis timeframe to your investment timeframe. Long-term investors should focus on weekly and monthly charts. Day traders focus on 5-minute and 15-minute charts. Using the wrong timeframe leads to whipsaw losses.
- Treating support and resistance as exact prices. Support and resistance are zones, not precise lines. A stock might bounce at $48.50 when you identified support at $50. Expect the price to react near the level, not exactly at it. Placing stop losses exactly at support guarantees you will be stopped out by normal price noise before the level holds.
- Confusing correlation with causation. Just because a chart pattern preceded a price move in the past does not mean the pattern caused the move. Technical patterns reflect human psychology, but they are not laws of physics. Always use position sizing and stop losses to manage risk, because any pattern can fail.
- Abandoning fundamentals entirely. Technical analysis tells you when to buy and sell. Fundamental analysis tells you what to buy. Buying a fundamentally terrible company because the chart looks good is gambling, not investing. The best traders combine both: fundamentals for stock selection, technicals for timing. Our post on what happens when the market crashes shows how technical signals can fail during extreme events.
Related Concepts
Technical analysis intersects with several investing and trading concepts. Moving averages are the most widely used technical indicator for identifying trends. Volume confirms or contradicts price moves and is essential for validating breakouts. Bull markets and bear markets are the macro trends that technical analysis seeks to identify and ride. Beta measures a stock's volatility relative to the market, which affects how technical patterns play out. Alpha represents excess returns, which technical traders seek to generate through timing. The S&P 500 is the most commonly analyzed index for technical signals. ETFs are the primary vehicles for trading index-level technical signals. Fundamental analysis is the complementary approach that focuses on company value rather than price action. Our posts on bull markets vs bear markets and how the stock market actually works provide context for how technical analysis fits into the broader market ecosystem. The Investment Return Calculator can help you model returns regardless of your analytical approach. The SEC provides investor education on technical analysis and trading at SEC.gov.
Frequently Asked Questions
Q: Does technical analysis actually work? A: It depends on how you define "work." Technical analysis is not a crystal ball. No indicator predicts future prices with certainty. But technical analysis can help you identify trends, manage risk, and time entries and exits better than guessing. Academic studies are mixed: some find that certain technical strategies generate excess returns, while others find that they do not outperform after transaction costs. The consensus among practitioners is that technical analysis is a useful tool when combined with discipline and risk management, not a standalone system for generating returns.
Q: What is the best technical indicator for beginners? A: Start with the 50-day and 200-day moving averages. They are simple, widely watched, and easy to interpret. When the 50-day is above the 200-day and both are rising, the trend is bullish. When the 50-day is below the 200-day and both are falling, the trend is bearish. Add RSI to identify overbought and oversold conditions, and volume to confirm price moves. These three indicators give you a solid foundation without overwhelming you with signals.
Q: Can I use technical analysis for long-term investing? A: Yes, but differently than traders. Long-term investors use technical analysis primarily for timing: when to enter a position, when to add to it, and when to exit. Weekly and monthly charts are more relevant than daily or hourly charts for long-term decisions. A long-term investor might use the 200-day MA to decide whether to deploy cash or hold it, rather than for day-to-day trading decisions. Dollar-cost averaging can reduce the need for precise market timing.
Q: What is the difference between a golden cross and a death cross? A: A golden cross occurs when the 50-day moving average crosses above the 200-day moving average, signaling a potential bull market. A death cross occurs when the 50-day crosses below the 200-day, signaling a potential bear market. These signals are widely followed but are lagging indicators, meaning they confirm a trend that has already begun rather than predicting it. Use them as confirmation, not as primary signals.
Q: Is technical analysis or fundamental analysis better? A: Neither is universally better. They answer different questions. Fundamental analysis tells you what to buy (which companies are undervalued). Technical analysis tells you when to buy and sell (when the price is at a favorable entry or exit point). Most successful investors use both. Warren Buffett uses fundamental analysis almost exclusively. Many hedge funds use technical analysis for trade timing on top of fundamental stock selection. The right approach depends on your timeframe, risk tolerance, and investment style.