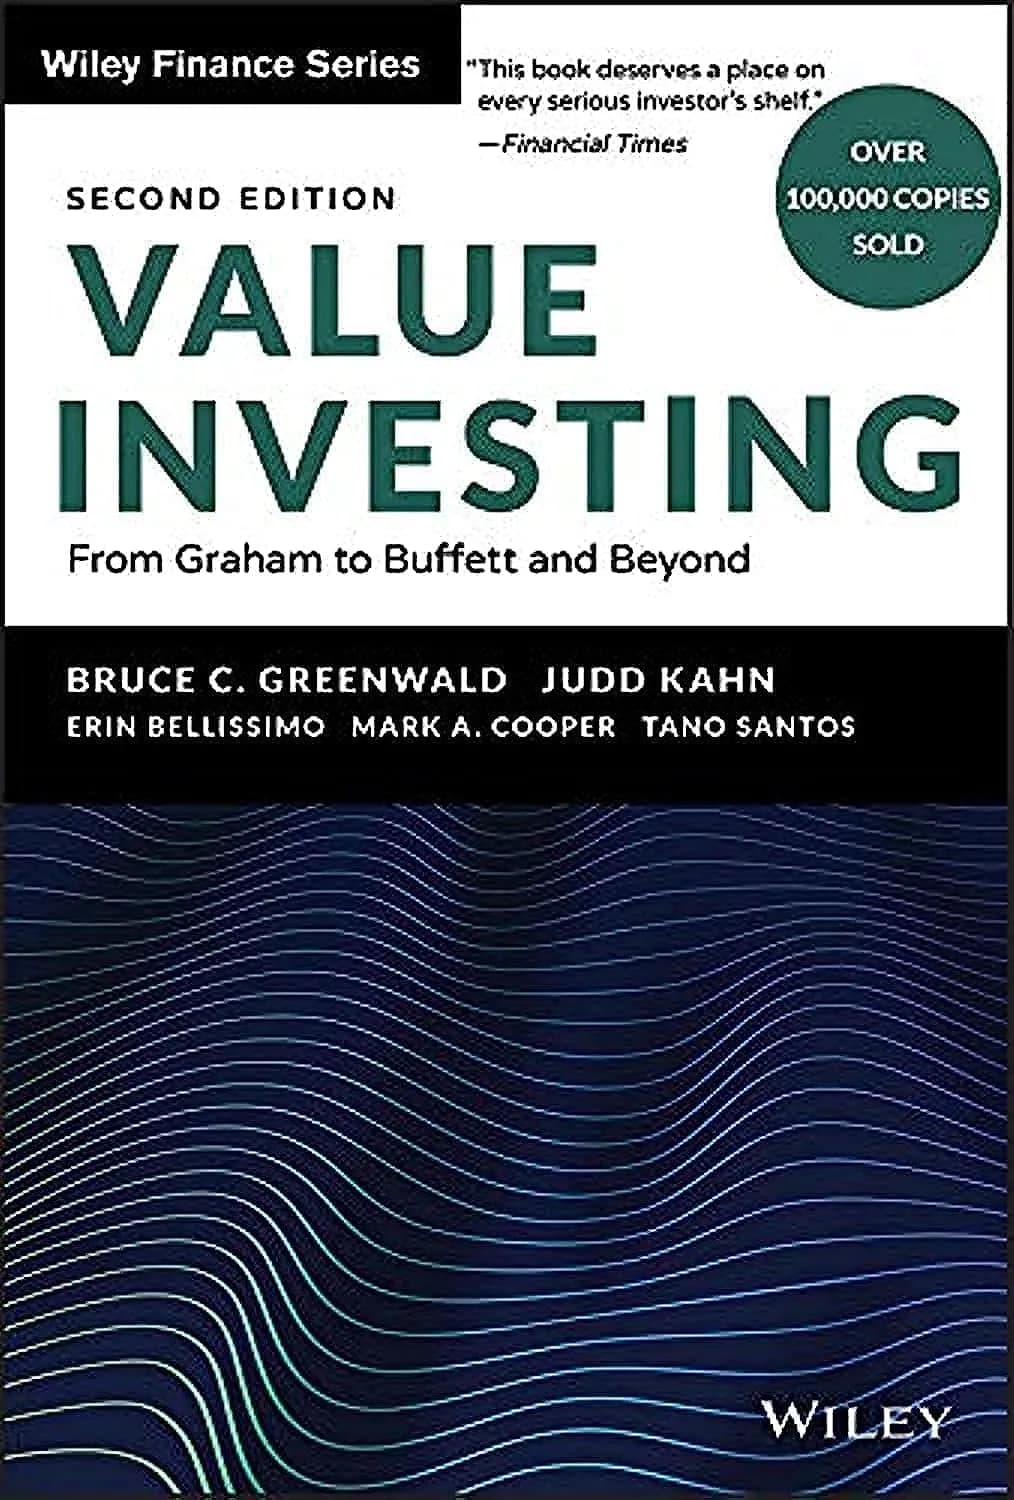
Discounted Cash Flow (DCF)
Quick Definition
Discounted cash flow (DCF) is a valuation method that calculates the present value of an investment based on the cash flows it is expected to generate in the future. The core idea is that a dollar received tomorrow is worth less than a dollar received today, so future cash flows must be discounted back to their present value using a rate that reflects the time value of money and the risk of the investment.
What It Means
DCF is how investors and analysts determine what a company, project, or asset is actually worth. Instead of relying on market price or comparing to similar companies, DCF builds value from the ground up by estimating how much cash the investment will produce over its lifetime and what that cash is worth today.
The method rests on one fundamental principle: the time value of money. A dollar today is worth more than a dollar in ten years because you can invest today's dollar and earn a return on it. If you can earn 5 percent per year, a dollar today becomes $1.63 in ten years. That means a dollar in ten years is worth only about $0.61 today. DCF applies this logic to every future cash flow an investment is expected to produce.
Warren Buffett and Charlie Munger made DCF famous as the basis of their value investing approach at Berkshire Hathaway. Buffett has said that intrinsic value is the discounted value of the cash that can be taken out of a business over its remaining life. While Buffett says he does not actually run spreadsheet DCF models, the concept drives his investment decisions.
DCF is used in three main contexts:
- Equity valuation: Estimating what a stock is worth to decide whether to buy, hold, or sell
- Corporate finance: Evaluating whether a project, acquisition, or capital expenditure will create value
- Private equity and venture capital: Pricing acquisitions, buyouts, and startup investments
The challenge with DCF is that it requires predicting the future. Small changes in assumptions about growth rates, profit margins, or the discount rate can produce wildly different valuations. This sensitivity is both the strength and weakness of DCF: it forces you to think carefully about every assumption, but it also means the output is only as good as the inputs.
How It Works
The DCF Formula
The basic DCF formula discounts each future cash flow back to its present value:
PV = CF1 / (1+r)^1 + CF2 / (1+r)^2 + CF3 / (1+r)^3 + ... + CFn / (1+r)^n
Where:
- PV = Present value
- CF = Cash flow in each period
- r = Discount rate
- n = Number of periods
Step 1: Project Future Cash Flows
The first step is estimating the cash flows the investment will generate. For a company, this typically means projecting free cash flow for 5 to 10 years, then estimating a terminal value for all cash flows beyond that period.
Most DCF models use a two-stage approach:
- Explicit forecast period: Project cash flows year by year for 5 to 10 years based on revenue growth, margin assumptions, and capital expenditure needs
- Terminal value: Estimate the value of all cash flows beyond the explicit period, usually using the Gordon Growth Model (perpetuity growth) or an exit multiple
Step 2: Choose a Discount Rate
The discount rate reflects the risk of the investment and the opportunity cost of capital. For most companies, the discount rate is the Weighted Average Cost of Capital (WACC), which blends the cost of equity and the cost of debt based on the company's capital structure.
The cost of equity is typically calculated using the Capital Asset Pricing Model (CAPM):
Cost of Equity = Risk-Free Rate + Beta x Equity Risk Premium
As of August 2026:
- Risk-free rate (10-year Treasury): approximately 4.69 percent
- Equity risk premium (implied, per Damodaran): approximately 4.23 percent
- Historical equity risk premium: 5.5 to 14.5 percent depending on the period
For a company with a beta of 1.2:
- Cost of equity = 4.69% + 1.2 x 4.23% = 9.77%
Step 3: Calculate Terminal Value
Terminal value captures the value of all cash flows beyond the explicit forecast. The most common method is the Gordon Growth Model:
Terminal Value = FCFn x (1+g) / (r - g)
Where g is the perpetual growth rate, typically 2 to 3 percent (in line with long-term GDP growth or inflation). Using a growth rate higher than the economy's long-term growth rate is unrealistic because no company can grow faster than the economy forever.
Step 4: Discount Everything to Present Value
Sum the present values of all projected cash flows and the terminal value to get the enterprise value. Subtract net debt to get equity value. Divide by shares outstanding to get the per-share intrinsic value.
Real-World Examples
Example 1: Simple DCF for a Mature Company
Let's value a company with the following assumptions:
- Current free cash flow: $100 million
- Growth rate (years 1-5): 8 percent
- Growth rate (years 6-10): 4 percent
- Terminal growth rate: 2.5 percent
- Discount rate (WACC): 9 percent
- Net debt: $200 million
- Shares outstanding: 50 million
| Year | FCF ($M) | Discount Factor | PV ($M) |
|---|---|---|---|
| 1 | 108.0 | 0.917 | 99.0 |
| 2 | 116.6 | 0.842 | 98.2 |
| 3 | 126.0 | 0.772 | 97.3 |
| 4 | 136.1 | 0.708 | 96.4 |
| 5 | 147.0 | 0.650 | 95.5 |
| 6 | 152.9 | 0.596 | 91.1 |
| 7 | 159.0 | 0.547 | 87.0 |
| 8 | 165.4 | 0.502 | 83.0 |
| 9 | 172.0 | 0.460 | 79.1 |
| 10 | 178.9 | 0.422 | 75.5 |
Sum of PV of explicit cash flows: $902.1 million
Terminal value at year 10: $178.9 x 1.025 / (0.09 - 0.025) = $2,823 million PV of terminal value: $2,823 x 0.422 = $1,191 million
Enterprise value: $902.1 + $1,191 = $2,093 million Equity value: $2,093 - $200 = $1,893 million Per share value: $1,893 / 50 = $37.86
If the stock trades at $30, the DCF suggests it is undervalued by about 26 percent. If it trades at $45, the DCF suggests it is overvalued by about 19 percent.
Example 2: Sensitivity to Assumptions
The same company valued with different terminal growth rates and discount rates:
| r = 8% | r = 9% | r = 10% | |
|---|---|---|---|
| g = 2.0% | $42.50 | $37.86 | $34.10 |
| g = 2.5% | $44.80 | $39.20 | $34.90 |
| g = 3.0% | $47.60 | $40.80 | $35.90 |
Changing the discount rate from 8 percent to 10 percent moves the valuation from $42.50 to $34.10, a swing of about 20 percent. Changing the terminal growth rate from 2 percent to 3 percent moves it from $37.86 to $40.80, about an 8 percent swing. This sensitivity is why DCF results should always be presented as a range, not a single number.
Example 3: DCF vs. Market Price
In August 2026, the S&P 500 traded at a forward P/E of about 20.0 and a trailing P/E of about 27, according to FactSet. The trailing earnings yield was about 3.4 percent, well below the 10-year Treasury yield of 4.69 percent. This means investors are paying a high price relative to current earnings, which a DCF would need to justify with strong future growth assumptions. The S&P 500 forward earnings estimate for 2027 was approximately $410 per share, with consensus earnings growth of about 13 percent projected for 2027. A DCF that assumes sustained high growth can justify current prices, but a more conservative model with lower terminal growth would produce a lower valuation. Read our guide on how the stock market actually works for more on market valuation.
Key Points to Remember
- DCF estimates intrinsic value by projecting future cash flows and discounting them to present value using a rate that reflects risk and the time value of money.
- The discount rate is typically the WACC, which blends the cost of equity (from CAPM) and the cost of debt.
- Terminal value usually represents 60 to 80 percent of the total DCF valuation, making the terminal growth assumption one of the most important inputs.
- Small changes in assumptions produce large changes in valuation. Always present DCF results as a range with sensitivity analysis.
- As of August 2026, the 10-year Treasury yield was about 4.69 percent and the implied equity risk premium was about 4.23 percent (per Damodaran).
- DCF is most reliable for mature companies with predictable cash flows. It is less useful for early-stage companies with negative or highly uncertain cash flows.
Common Mistakes to Avoid
- Using an unrealistic terminal growth rate: No company can grow faster than the economy forever. Keep terminal growth at 2 to 3 percent, in line with long-term GDP growth and inflation. Using 5 percent or higher inflates the terminal value dramatically.
- Being too aggressive with near-term growth: Projecting 20 percent annual growth for 10 years is rarely realistic. Most companies revert to single-digit growth within a few years. Check your assumptions against historical growth rates and industry averages.
- Ignoring the discount rate's impact: A 1 percent change in the discount rate can move the valuation by 15 to 25 percent. Test your model with a range of discount rates to understand the sensitivity.
- Treating DCF output as precise: DCF produces an estimate, not a fact. The output is only as good as the inputs. Use DCF as one tool alongside comparable company analysis, precedent transactions, and market multiples. Read about fundamental analysis for a broader framework.
- Forgetting to subtract net debt: Enterprise value includes the value of debt. To get equity value (what shareholders own), subtract net debt from enterprise value before dividing by shares outstanding.
- Using DCF for companies with no cash flow: Startups and early-stage companies often have negative free cash flow for years. DCF requires estimating when and how much cash flow will eventually materialize, which is highly speculative. Use other methods like comparable analysis or revenue multiples for these companies.
Related Concepts
DCF is built on the concept of the time value of money and uses free cash flow as its primary input. The discount rate is often derived from the Capital Asset Pricing Model (CAPM), which uses beta to measure risk. DCF produces an intrinsic value estimate that can be compared to market price to identify undervalued or overvalued stocks. It is a core tool of fundamental analysis and valuation. The discount rate used in DCF reflects the risk of the investment. Earnings are related but distinct from cash flow, since accounting earnings include non-cash items. Read our guides on common investing mistakes beginners make, how the stock market actually works, and when to sell a stock or fund. Use our investment return calculator to model investment growth.
Frequently Asked Questions
Q: Is DCF the same as net present value (NPV)? A: DCF is the method of discounting future cash flows to present value. NPV is the result of subtracting the initial investment from the DCF. If you are valuing a company, the DCF gives you the enterprise value. If you are evaluating a project, NPV tells you whether the project creates value (NPV greater than zero) or destroys it (NPV less than zero).
Q: What discount rate should I use in a DCF? A: For most companies, use the Weighted Average Cost of Capital (WACC). The cost of equity component is calculated using CAPM: risk-free rate plus beta times the equity risk premium. As of August 2026, the 10-year Treasury yield was about 4.69 percent and the implied equity risk premium was about 4.23 percent. For a company with a beta of 1.0, the cost of equity would be about 8.9 percent.
Q: Why does terminal value matter so much in a DCF? A: Terminal value typically represents 60 to 80 percent of the total DCF valuation because it captures all cash flows beyond the explicit forecast period. This means the terminal growth rate assumption has an outsized impact on the final valuation. A small change in terminal growth can swing the valuation by 10 to 20 percent.
Q: Can I use DCF to value an index fund or the whole stock market? A: Yes. DCF can be applied to the S&P 500 by projecting aggregate earnings or free cash flow and discounting it. Damodaran publishes an implied equity risk premium for the S&P 500 each month using this approach. As of early 2026, the implied ERP was 4.23 percent, which was in line with the historical average despite elevated valuations. The SEC's investor guidance provides additional information on valuation methods.
Q: What is the difference between DCF and comparable company analysis? A: DCF builds value from the ground up using projected cash flows and a discount rate. Comparable company analysis values a company by applying valuation multiples (such as P/E or EV/EBITDA) from similar companies. DCF is more theoretically sound but depends heavily on assumptions. Comparable analysis is simpler but relies on the market pricing similar companies correctly. Most analysts use both methods and compare the results.