Fundamental Analysis
Quick Definition
Fundamental analysis is the process of evaluating a stock by studying the underlying company's financial statements, business operations, competitive position, and industry conditions to estimate what the business is actually worth. The goal is to determine whether the stock's market price is above or below its intrinsic value, which tells you whether to buy, hold, or sell.
What It Means
Every stock has two prices: the market price, which changes every second based on supply and demand, and the intrinsic value, which is what the business is actually worth based on its earnings, assets, and cash flows. Fundamental analysis is how you estimate that second number.
The approach starts with the raw data that every public company is required to file with the SEC. U.S. public companies file a 10-K annual report and a 10-Q quarterly report containing audited financial statements, management discussion, risk factors, and operational details. These filings are free and publicly available on the SEC's EDGAR system. A typical 10-K runs 80 to 300 pages, and most retail investors never read them. That information gap is exactly what fundamental analysis exploits.
Fundamental analysts look at three layers of information. The first is the company itself: its financial statements, management team, products, and competitive position. The second is the industry: market size, growth rate, competitive dynamics, and regulatory environment. The third is the macroeconomy: interest rates, inflation, GDP growth, and consumer trends. The analysis works from the bottom up (company first) or the top down (macro first), but the goal is the same: estimate intrinsic value and compare it to the market price.
In 2026, fundamental analysis has been given a boost by artificial intelligence tools that can process 10-K filings in minutes. Large language models can extract risk factors, summarize MD&A sections, and flag accounting irregularities that would take a human analyst hours to identify. But AI is a tool, not a replacement for judgment. The numbers still need to be interpreted, and the business still needs to be understood. The SEC's FY 2026 examination priorities specifically flagged AI as an emerging risk in financial services, noting that firms using AI for investment analysis must have controls to ensure recommendations remain in clients' best interests.
How It Works
Step 1: Read the Financial Statements
Three statements form the core of fundamental analysis:
The Income Statement shows revenue, expenses, and profit over a period. Key line items include revenue, cost of goods sold, gross profit, operating expenses, operating income, interest expense, taxes, and net income. This statement tells you whether the company is profitable and whether profitability is growing or shrinking.
The Balance Sheet shows assets, liabilities, and shareholders' equity at a point in time. Key line items include cash, receivables, inventory, property and equipment, total assets, short-term debt, long-term debt, total liabilities, and shareholders' equity. This statement tells you what the company owns, what it owes, and what is left for shareholders.
The Cash Flow Statement shows how cash moved through the business over a period. It is divided into operating cash flow (cash from core business operations), investing cash flow (capital expenditures and acquisitions), and financing cash flow (debt issuance, dividends, buybacks). This statement tells you whether the company generates actual cash, which is harder to manipulate than accounting earnings.
Step 2: Calculate Financial Ratios
Ratios turn raw financial statement numbers into comparable metrics. Here are the key categories:
| Category | Key Ratios | What They Tell You |
|---|---|---|
| Profitability | Gross margin, operating margin, net margin, ROE, return on capital | How efficiently the company converts revenue into profit |
| Liquidity | Current ratio, quick ratio, cash ratio | Whether the company can pay short-term obligations |
| Leverage | Debt-to-equity, debt-to-EBITDA, interest coverage | How much debt the company carries and whether it can service it |
| Efficiency | Asset turnover, inventory turnover, receivables turnover | How efficiently the company uses its assets to generate sales |
| Valuation | P/E, P/B, EV/EBITDA, PEG, dividend yield | Whether the stock is cheap or expensive relative to fundamentals |
| Growth | Revenue growth, earnings growth, EPS growth | Whether the business is expanding or contracting |
Step 3: Read the 10-K Narrative Sections
The numbers tell half the story. The narrative sections of the 10-K tell the other half:
- Item 1 (Business): What the company does, its products, markets, and competitive position
- Item 1A (Risk Factors): Management's own disclosure of what could go wrong. This is often the most honest section of the filing because companies have legal incentives to disclose risks thoroughly
- Item 7 (MD&A): Management's Discussion and Analysis explains the "why" behind the numbers. Why did revenue grow? Why did margins decline? What does management expect next year?
- Item 8 (Financial Statements): The audited financial statements and footnotes. The footnotes are where accounting complexity hides: revenue recognition policies, off-balance-sheet items, pension assumptions, and related-party transactions
Step 4: Estimate Intrinsic Value
Combine the financial ratios, narrative analysis, and industry context to estimate what the business is worth. The primary tool is discounted cash flow (DCF) analysis:
- Project free cash flows for 5 to 10 years based on revenue growth and margin assumptions
- Estimate a terminal value for cash flows beyond the projection period
- Discount all future cash flows to present value using your required return
- Compare the intrinsic value per share to the current market price
Step 5: Assess Qualitative Factors
Numbers alone do not tell the full story. Qualitative factors that affect intrinsic value include:
- Does the company have an economic moat protecting its profitability?
- Is management honest and competent? Read the proxy statement and listen to earnings calls
- Is the industry growing, stable, or shrinking?
- Are there regulatory risks, technological disruption, or geopolitical exposure?
- Does the company have pricing power?
Real-World Examples
Ratio Analysis in Practice
Consider two companies in the same sector. Company A has a gross margin of 45%, operating margin of 18%, return on capital of 22%, and debt-to-equity of 0.3. Company B has a gross margin of 28%, operating margin of 8%, return on capital of 7%, and debt-to-equity of 1.8. Both trade at 12x earnings.
Fundamental analysis tells you Company A is the better business. Higher margins indicate pricing power or cost advantages. Higher return on capital indicates efficient capital allocation. Lower leverage indicates financial safety. Even though both stocks trade at the same P/E, Company A is cheaper relative to the quality of the business. Company B may be a value trap if its margins and returns are declining.
Reading Risk Factors for Red Flags
A company's 10-K risk factors section can reveal problems that the income statement hides. If a company adds new risk factors about supply chain disruption, customer concentration, or regulatory investigations, those are signals to investigate further. If risk factors are removed or softened compared to the prior year, that can signal improvement.
In 2026, many companies added AI-related risk factors to their 10-K filings, disclosing that AI could disrupt their business models, displace their services, or create competitive threats. Morningstar's 2026 moat review downgraded 37 companies based on AI disruption risk, including Salesforce, Oracle, and Adobe. Reading the risk factors section of those 10-Ks would have given you early warning of the AI threat to their business models.
The Footnote Trap
Footnotes to financial statements are where companies bury uncomfortable details. A company might report clean earnings growth while a footnote reveals that it changed its revenue recognition policy to recognize revenue earlier, or that it capitalized operating expenses to boost reported profit, or that it has off-balance-sheet commitments that could become liabilities.
Enron is the classic example. Enron's footnotes disclosed special purpose entities and related-party transactions that, had they been read carefully, would have revealed the company was hiding debt and inflating earnings. The income statement looked fine. The footnotes told a different story. Fundamental analysis means reading the footnotes, not just the headline numbers.
Key Points to Remember
- Fundamental analysis estimates intrinsic value by studying financial statements, business quality, and industry context
- The three core financial statements are the income statement, balance sheet, and cash flow statement
- The 10-K's Item 1A (Risk Factors) and Item 7 (MD&A) are where the most valuable qualitative information lives
- Financial ratios turn raw numbers into comparable metrics across companies and time periods
- DCF analysis is the primary tool for converting fundamental analysis into an intrinsic value estimate
- The SEC's EDGAR system provides free access to all public company filings at SEC.gov
- AI tools can accelerate 10-K analysis but do not replace human judgment in interpreting results
Common Mistakes to Avoid
- Focusing on a single metric. A low P/E ratio does not mean a stock is undervalued. A high return on equity does not mean a business is good if it is achieved through excessive leverage. Always look at multiple ratios across profitability, liquidity, leverage, efficiency, and valuation categories. A company that screens well on one metric and poorly on four others is probably not the bargain it appears to be.
- Ignoring the footnotes. The financial statements themselves are standardized. The footnotes are where companies exercise accounting discretion. Revenue recognition policies, pension assumptions, lease accounting, and related-party transactions are all disclosed in footnotes. Skipping them means missing the details that can invalidate your entire analysis.
- Extrapolating the past into the future. Just because a company grew revenue 15% per year for five years does not mean it will grow 15% for the next five. Markets saturate, competition intensifies, and business cycles turn. Build your DCF model with conservative assumptions and test how sensitive your intrinsic value estimate is to changes in growth rates and margins.
- Confusing accounting profit with economic profit. A company can report positive net income while destroying shareholder value if its return on capital is below its cost of capital. Always compare return on capital against the cost of capital, not against zero. A company earning 8% on capital with a 9% cost of capital is destroying value, even though it is profitable on paper.
- Over-relying on AI summaries. AI tools can extract and summarize 10-K content quickly, but they can also miss context, misinterpret tone, and hallucinate facts. Use AI as a starting point to identify key sections and flag potential issues, then read the actual filing to verify. The SEC's 2026 exam priorities flagged AI as an emerging risk in financial services, noting that firms must have controls over AI-generated recommendations.
Related Concepts
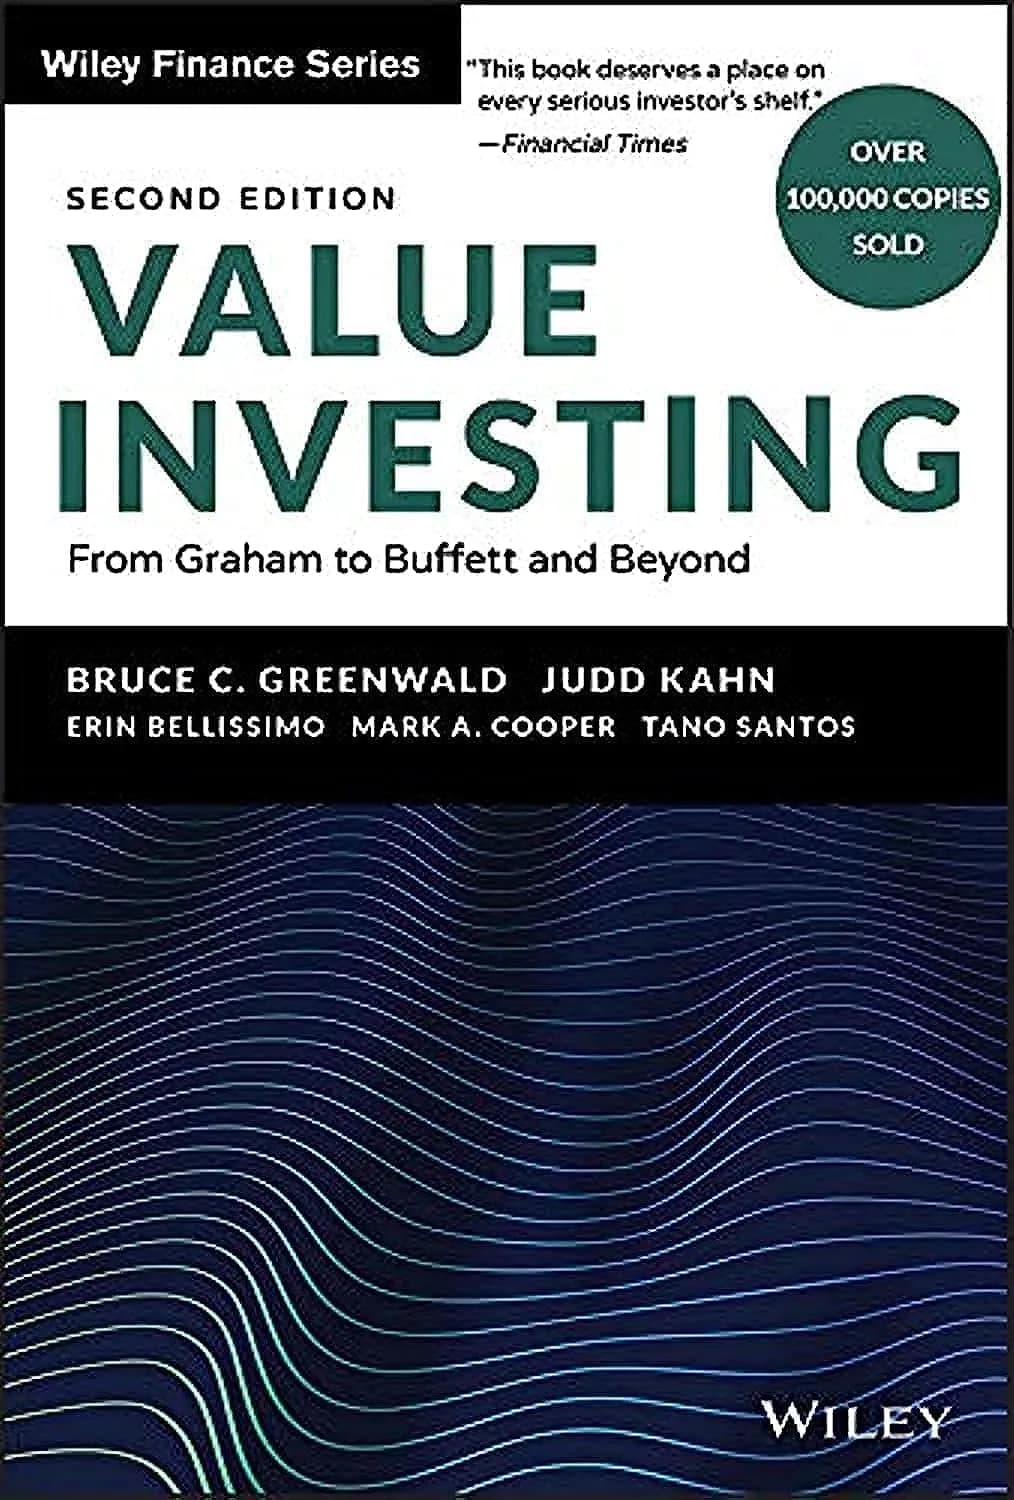
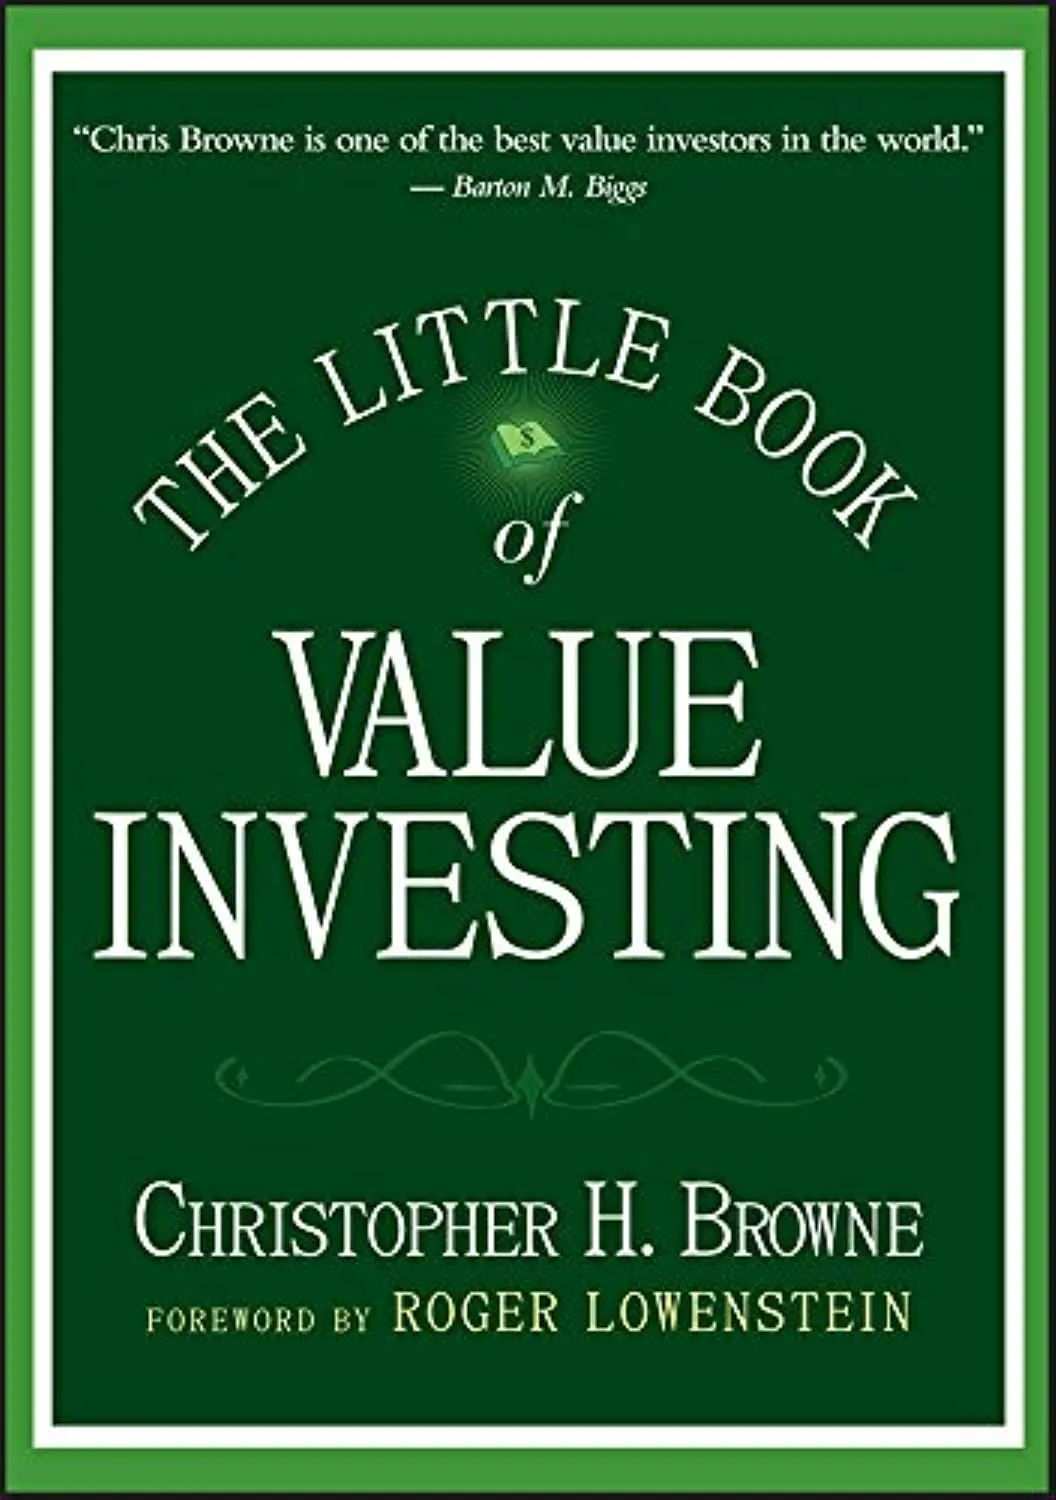
Fundamental analysis is the foundation of value investing, which uses fundamental data to buy stocks below intrinsic value. The 10-K annual report is the primary source document, containing audited financials and management commentary. The balance sheet shows what the company owns and owes. The cash flow statement reveals whether the business generates actual cash. Intrinsic value is the output of fundamental analysis: what the business is worth based on its fundamentals. Return on capital is the key profitability metric that separates quality businesses from value destroyers. Economic moats are the qualitative competitive advantages that fundamental analysis seeks to identify. DCF analysis is the quantitative method for converting fundamental analysis into a per-share intrinsic value estimate. Technical analysis is the alternative approach that ignores fundamentals and focuses on price patterns. Our post on how the stock market actually works provides context for how fundamental analysis fits into the broader investing process, and our guide on common investing mistakes beginners make covers errors in fundamental analysis. The Investment Return Calculator can help you model the intrinsic value estimates you derive from your analysis.
Frequently Asked Questions
Q: Do I need to read the entire 10-K to do fundamental analysis? A: No, but you should read the key sections. Focus on Item 1 (Business), Item 1A (Risk Factors), Item 7 (MD&A), and Item 8 (Financial Statements with footnotes). For a first pass, the MD&A and risk factors sections give you the most insight into what management is thinking and what could go wrong. The financial statements give you the numbers. AI tools can help you extract and summarize these sections quickly, but verify key findings against the actual filing on SEC.gov.
Q: How long does it take to analyze a stock fundamentally? A: A thorough fundamental analysis of a single company takes 4 to 8 hours for an experienced analyst: reading the 10-K, calculating ratios, building a DCF model, and assessing qualitative factors. AI tools can reduce the initial extraction and summarization to under 30 minutes, but interpretation and judgment still require human time. For a portfolio of 20 stocks, expect to spend several weeks of part-time work on initial analysis, plus ongoing monitoring.
Q: What is the difference between fundamental and technical analysis? A: Fundamental analysis studies the company: its financial statements, business model, and competitive position, to estimate intrinsic value. Technical analysis studies the stock: its price history, trading volume, and chart patterns, to predict future price movements. Fundamental analysts ask "what is this business worth?" Technical analysts ask "where is this stock price going?" Most professional investors use some combination of both, but value investors rely primarily on fundamentals.
Q: Can fundamental analysis predict short-term stock movements? A: Not reliably. In the short run, stock prices are driven by sentiment, news flow, and institutional flows, not fundamentals. Fundamental analysis predicts long-term outcomes: over 3 to 5 years, stock prices tend to converge toward intrinsic value. If you need to predict what a stock will do next quarter, fundamental analysis will not help much. If you want to know whether a stock will be higher in five years, fundamental analysis is the best tool available.
Q: What are the most important financial ratios for beginners? A: Start with five: price-to-earnings (P/E) for valuation, return on equity (ROE) for profitability, debt-to-equity for leverage, current ratio for liquidity, and revenue growth for growth. These five give you a quick picture of whether a stock is cheap, profitable, financially safe, and growing. As you get more comfortable, add return on capital, free cash flow yield, gross margin trends, and EV/EBITDA. The SEC provides a beginner's guide to reading financial statements at SEC.gov.