*Disclosure: This article contains affiliate links. If you purchase through these links, we may earn a commission at no additional cost to you. We only recommend books we have personally read and genuinely believe in.
Quick Overview
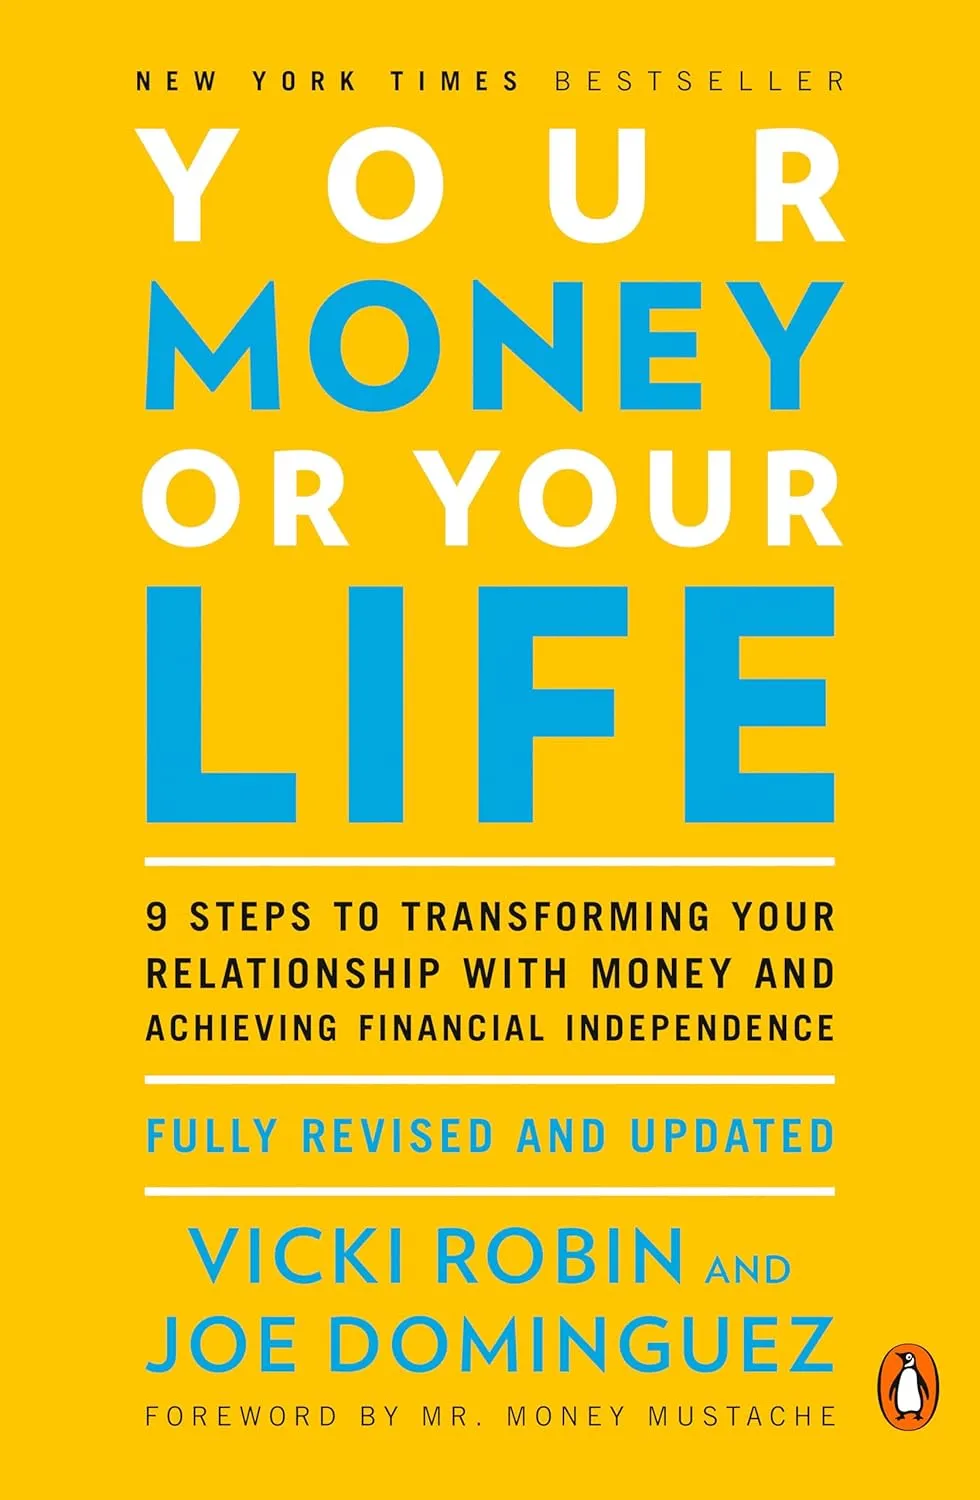
Joe Dominguez retired at 31 in 1969 on investment income from $70,000 in savings. He spent the rest of his life teaching others his approach, which he developed with Vicki Robin into a nine-step program published in 1992. Your Money or Your Life is the philosophical and practical foundation of the FIRE (Financial Independence, Retire Early) movement. Its central reframe, money is life energy and every purchase trades finite life hours, has changed the financial trajectories of millions of readers. I tried the tracking exercise myself for three months in 2024, and the simple act of converting every purchase into hours of life reduced my discretionary spending by 30% without feeling deprived. The book's crossover point concept remains the clearest definition of financial independence ever written, though the safe withdrawal rate math needs updating for 2026.
Book Details
| Attribute | Details |
|---|---|
| Title | Your Money or Your Life |
| Authors | Vicki Robin & Joe Dominguez (updated edition with Monique Tilford) |
| Publisher | Penguin Books |
| First Published | 1992 |
| Updated Edition | 2008 (major update), 2018 (minor update) |
| Pages | 368 |
| Reading Level | Beginner |
| Amazon Rating | 4.7/5 stars |
Get Your Copy
Paperback: Buy on Amazon
Kindle: Buy on Amazon
Audiobook: Buy on Amazon
About the Authors
Joe Dominguez (1938-1997) was a Wall Street analyst who developed his frugality and investment philosophy in the 1960s and retired at 31 to pursue non-profit work. He lived simply on investment income and spent his retirement years teaching others his approach through cassette tapes and workshops before the book was published.
Vicki Robin is a writer, activist, and co-founder of the New Road Map Foundation. She has updated the book through multiple editions to address contemporary context including index funds, housing markets, and digital tools.
The Central Reframe: Money Is Life Energy
The book's most important contribution is this single conceptual shift: money is not an end. It is what you get in exchange for your life energy, the hours of finite, irreplaceable life you spend earning it.
Your Real Hourly Wage
Most people calculate their income by dividing annual salary by 2,080 working hours. This dramatically overstates what you actually earn per hour of life spent on work:
| Factor | Hours Lost Per Week |
|---|---|
| Commuting | 5 hours |
| Decompressing from work | 3 hours |
| Work clothing and maintenance | 1 hour |
| Work-related meals and socializing | 2 hours |
| Convenience spending to compensate for tiredness | Indirect time loss |
| Total extra hours | 11+ hours beyond 40 |
If you work 40 hours but spend 51 hours on work-related activities, and earn $70,000/year, your real hourly wage is:
$70,000 / 52 weeks / 51 hours = $26.40/hour
(vs. the nominal $33.65/hour from salary alone)
But that is before taxes. After a 25% effective tax rate:
$70,000 × 0.75 = $52,500 net / 51 hours / 52 weeks = $19.79/hourEvery purchase costs more life energy than the price tag suggests. A $300 television does not cost $300. At a real hourly wage of $19.79, it costs 15+ hours of your finite life.
When I first did this calculation with my own salary, I discovered my real hourly wage was $22/hour, not the $38/hour I had been telling myself. That $1,200 laptop I bought on impulse was not $1,200. It was 54 hours of my life. I returned it.
The Nine-Step Program
Step 1: Making Peace with the Past
Calculate your total lifetime earnings and your current net worth. The gap between what you have earned and what you have kept is the price of not being conscious about money.
The lifetime earnings exercise:
Most people find this calculation shocking. The average American earns $1.5-2 million over a working life. Many end up with net worths far below what this would suggest if invested carefully.
Why this matters: It creates an honest baseline and the motivation to treat future earnings differently.
Step 2: Being in the Present, Tracking Your Life Energy
Track every penny that comes in and goes out. Every single transaction.
Robin and Dominguez are emphatic: not budgeting (which decides in advance), but tracking (which builds honest awareness).
The tracking tool:
| Date | Category | Amount | Life Hours Equivalent |
|---|---|---|---|
| 3/1 | Coffee | $6.50 | 0.33 hours |
| 3/1 | Lunch | $18.00 | 0.91 hours |
| 3/2 | New shoes | $120 | 6.06 hours |
| 3/4 | Streaming services | $65 | 3.28 hours |
| Monthly total | All categories | $4,200 | 212 hours |
Converting expenditures to life hours creates a radically different emotional relationship with spending. Spending $120 on shoes feels different than spending 6 hours of your finite life.
Step 3: Monthly Tabulation
Organize all income and expenses into categories that are meaningful to your life. Sum each category monthly.
The categories should reflect your actual spending patterns, not a generic budget template. If you spend $400/month on pet supplies, that deserves its own category.
Step 4: Three Questions
For each spending category each month, ask three questions:
These questions are not about guilt. They are about conscious alignment. Some categories will feel worth every life hour. Others will feel wasteful.
The Fulfillment Curve
Robin introduces a concept she calls the fulfillment curve:
| Spending Level | Fulfillment |
|---|---|
| Survival (food, shelter, basic clothing) | High, each dollar very fulfilling |
| Comforts (nicer home, quality food, reliable car) | Still high |
| Luxuries (bigger house, luxury car) | Declining, more spending, less additional fulfillment |
| Excess (spending beyond satiation) | Negative, managing excess creates burden |
Most developed-world middle-class households are spending in the declining and sometimes negative zones. The three questions identify which spending is genuinely fulfilling and which is habitual or status-driven.
Step 5: Making Life Energy Visible
Create a large wall chart with two lines:
Update it monthly. Make it visible. The visual representation creates accountability that abstract numbers in a spreadsheet do not.
The power of the wall chart: Robin describes families who transformed their spending behavior simply from having this visible in their homes. The public commitment effect (your family and guests see it) and the visual representation combine to create powerful behavioral change.
Step 6: Valuing Your Life Energy, Minimizing Spending
The goal is not to spend as little as possible but to spend in alignment with your values. This step focuses on reducing spending that does not match your values.
Step 7: Valuing Your Life Energy, Maximizing Income
Maximize the life energy you receive for each dollar earned. This may mean negotiating raises, developing higher-value skills, or finding work that is more intrinsically rewarding per dollar earned. Both sides of the life energy equation matter.
Step 8: Capital and the Crossover Point
The crossover point is when monthly investment income equals monthly expenses. At this point, paid work becomes optional.
Calculating your crossover point:
| Monthly Expenses | Required Portfolio (at 4% withdrawal rate) |
|---|---|
| $2,000 | $600,000 |
| $3,000 | $900,000 |
| $4,000 | $1,200,000 |
| $5,000 | $1,500,000 |
| $6,000 | $1,800,000 |
The double accelerant: reducing expenses has two effects simultaneously. Your monthly investment income needs are lower (the crossover point is closer), and more income is available for investment (you reach the crossover point faster).
Every $100/month reduction in spending cuts the required portfolio by $30,000 and accelerates savings rate by $1,200/year. The impact compounds rapidly.
Example: The effect of lifestyle optimization
| Scenario | Monthly Expenses | Portfolio Needed | Years to FI (starting at $0, saving $2K/month at 8%) |
|---|---|---|---|
| High consumption | $6,000 | $1,800,000 | ~28 years |
| Moderate reduction | $4,500 | $1,350,000 | ~23 years |
| Intentional frugality | $3,000 | $900,000 | ~17 years |
Cutting $3,000/month in spending, while simultaneously freeing $3,000/month for investment, cuts the timeline to financial independence by 11 years.
Step 9: Managing Your Finances
Robin and Dominguez recommend investing in Treasury bonds to generate the crossover point income. This is the most dated element of the book. In 1992, government bonds yielding 6-8% provided a safe, reliable income stream. In most modern environments, a diversified index fund portfolio with a reasonable withdrawal rate is more appropriate.
The 2026 Safe Withdrawal Rate Update
The crossover point calculation depends entirely on the safe withdrawal rate you use. The book's original 1992 edition assumed bond yields of 6-8%, which made the math easy. The 2018 update adopted the 4% rule from the Trinity Study. As of July 2026, the research has evolved significantly.
Three Competing Numbers for 2026
| Source | 2026 Safe Rate | Year-1 on $1M | What It Represents |
|---|---|---|---|
| Morningstar (Dec 2025) | 3.9% | $39,000 | Forward-looking, 90% success over 30 years, Monte Carlo |
| Classic 4% rule (Trinity) | 4.0% | $40,000 | Historical worst-case anchor |
| Bengen updated (Aug 2025) | 4.7% | $47,000 | Revised worst case with broader diversification |
| Bengen flexible | 5.25-5.5% | $52,500-$55,000 | For retirees willing to adjust spending |
Bill Bengen, who invented the 4% rule in 1994, published A Richer Retirement in August 2025. He ran his simulation again with updated market history and found that the worst-case year is 1968 (stagflation). The SAFEMAX for a 30-year retirement with a diversified portfolio (adding small-cap, mid-cap, and international stocks) is 4.7%, not 4.15%.
Morningstar's December 2025 research takes a forward-looking approach. They run Monte Carlo simulations on current market conditions, where the Shiller CAPE ratio sits around 40 against a long-run average near 17. High valuations historically mean lower future returns, which pulls their safe rate down to 3.9%.
What This Means for FIRE
For a 30-year traditional retirement, the range of 3.9-4.7% is workable. For FIRE practitioners with 40-50 year horizons, the numbers change:
| Retirement Length | Safe Withdrawal Rate | Multiplier (x annual expenses) |
|---|---|---|
| 30 years (traditional) | 3.9-4.0% | 25x |
| 40 years (retire at 50) | 3.4-3.6% | 28x |
| 50 years (retire at 40) | 3.0-3.3% | 30-33x |
| 60 years (retire at 35) | 2.8-3.0% | 33-36x |
Source: My Financial Freedom Tracker and FireNum
For someone targeting $60,000/year in expenses, the difference between 25x and 33x is $1.5M versus $2.0M. That is $500,000 of additional savings required because you plan to retire 20 years earlier.
The Underspending Problem
Research on actual retiree behavior consistently shows that married retirees withdraw only about 2.1% of their portfolio annually. Singles withdraw even less, around 1.9%. The Employee Benefit Research Institute found that retirees with $500,000 or more at retirement still had, on average, 88% of their pre-retirement assets remaining after 18 years.
While the internet argues about whether 3.9% or 4.0% is the right number, real retirees are withdrawing at half those rates. They die with portfolios larger than what they retired with. This validates Robin and Dominguez's core point: conscious spending tends to produce underspending, not overspending, once the habit is established.
The FIRE Movement in 2026: Evolution and Criticism
Your Money or Your Life predated the internet, social media, and the modern FIRE movement by decades. It created the philosophical foundation that Mr. Money Mustache, JL Collins, and hundreds of FIRE bloggers later popularized. But the movement has evolved and faced real-world stress tests since the book was published.
How FIRE Has Evolved
The original FIRE model was simple: slash expenses, max accounts, buy index funds, retire early. The 2026 reality is more nuanced:
| FIRE Variant | Description | 2026 Viability |
|---|---|---|
| Lean FIRE | Extremely low expenses, fastest path | Harder, housing costs up 40% since 2020 |
| Fat FIRE | Comfortable lifestyle, high assets | Viable for high earners |
| Barista FIRE | Part-time work covers expenses | Growing in popularity, maintains health benefits |
| Coast FIRE | Early savings compound, work covers current expenses | Most practical for broader population |
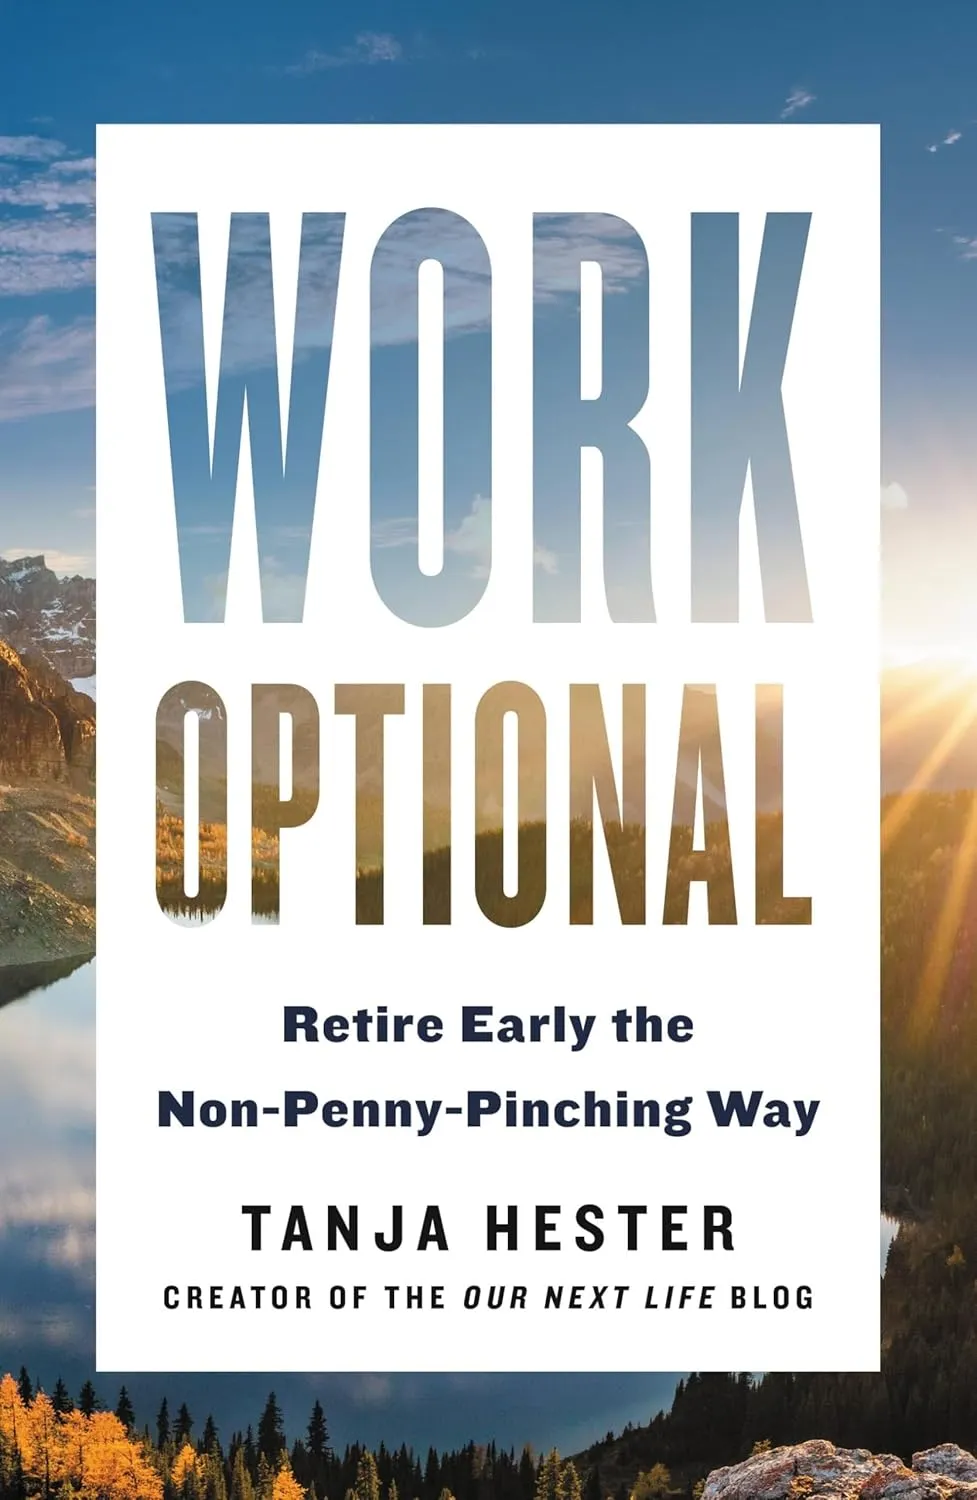
A 2024 research study found that many FIRE followers are interested in independence rather than early retirement. Laura Sondy, a professor of organizational behavior at UNC Chapel Hill, told Business Insider that many pursuing FIRE today do not plan to stop working altogether. They want work that fits better with the life they want. The term "work optional," popularized by FIRE author Tanja Hester, captures this shift.
The Healthcare Gap
The most overlooked challenge for early retirees is healthcare. A 35-year-old planning to retire at 50 faces approximately $380,000 in healthcare costs before Medicare eligibility at 65, in today's dollars, before medical inflation running at nearly 5% annually. Marketplace premiums for early retirees average $600-1,200+ monthly for individuals before deductibles, according to Kaiser Family Foundation research cited by Retirement Success.
This cost alone can add $9,600+ annually to expenses, pushing the FIRE number up by $240,000 at a 4% withdrawal rate.
The Savings Rate Context
The US personal savings rate sat at 3.0% in May 2026, according to the Bureau of Economic Analysis, down from 4.9% a year earlier and well below the long-term average of 8.36%. Total household liabilities reached a record $19.9 trillion. Against this backdrop, the book's message about conscious consumption is more relevant than ever, even if the specific investment advice needs updating.
Strengths & Weaknesses
What We Loved
Areas for Improvement
Who Should Read This Book
Highly Recommended For
Probably Not For
Comparison to Similar Books
| Book | Philosophy | Tactical Detail | FIRE Focus |
|---|---|---|---|
| Your Money or Your Life | Very High | Medium | Very High |
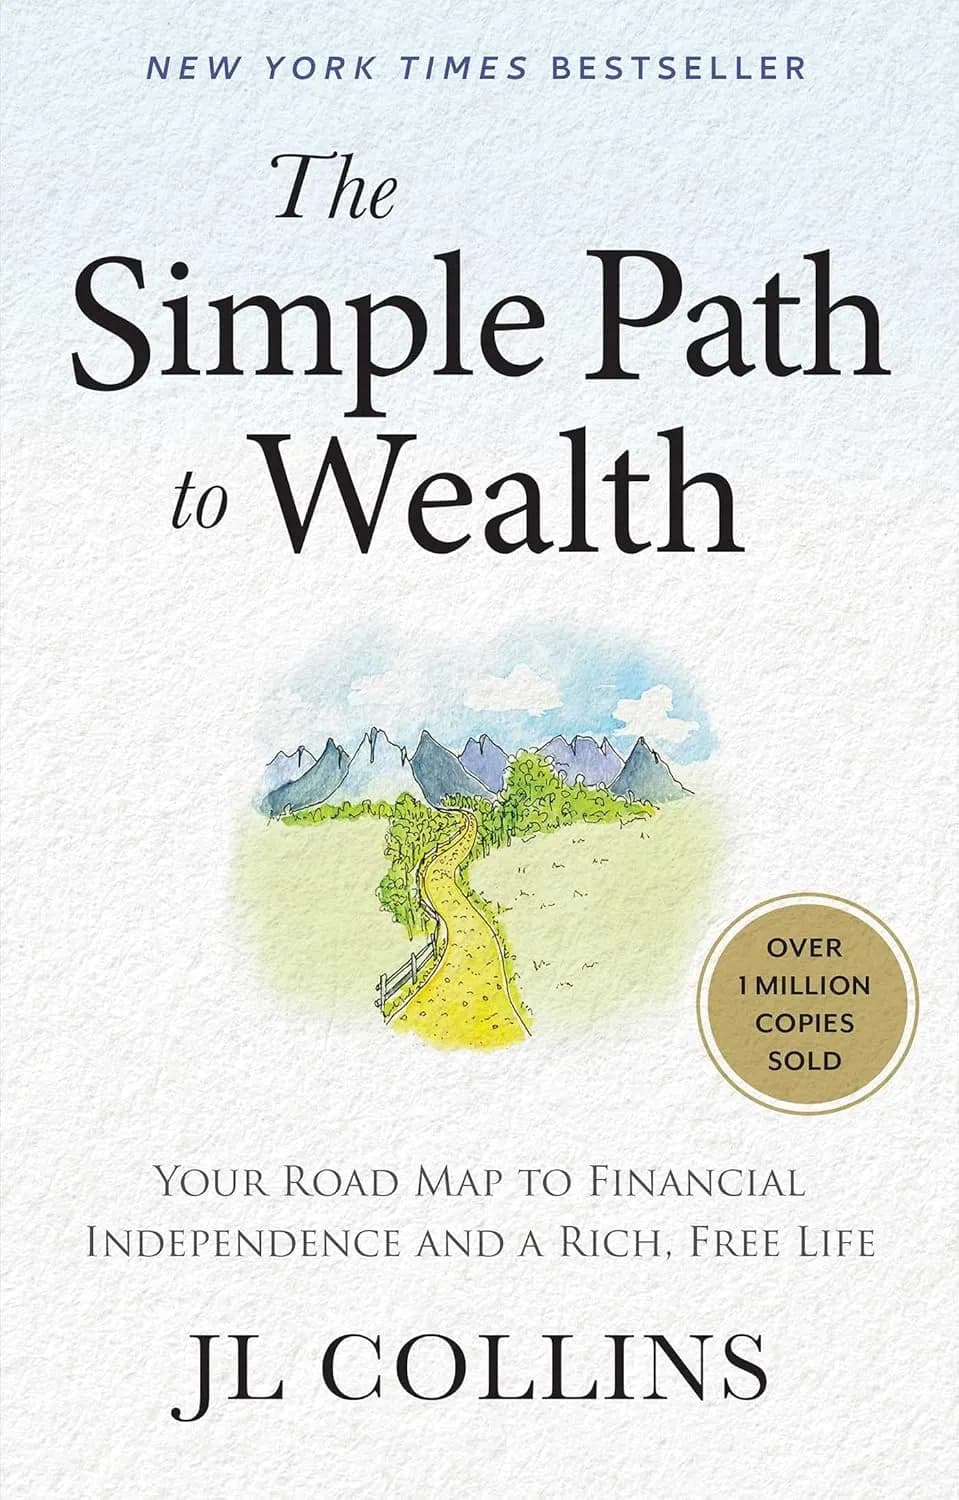
| The Simple Path to Wealth | Medium | Very High | High |
| Early Retirement Extreme | High | Very High | Very High |
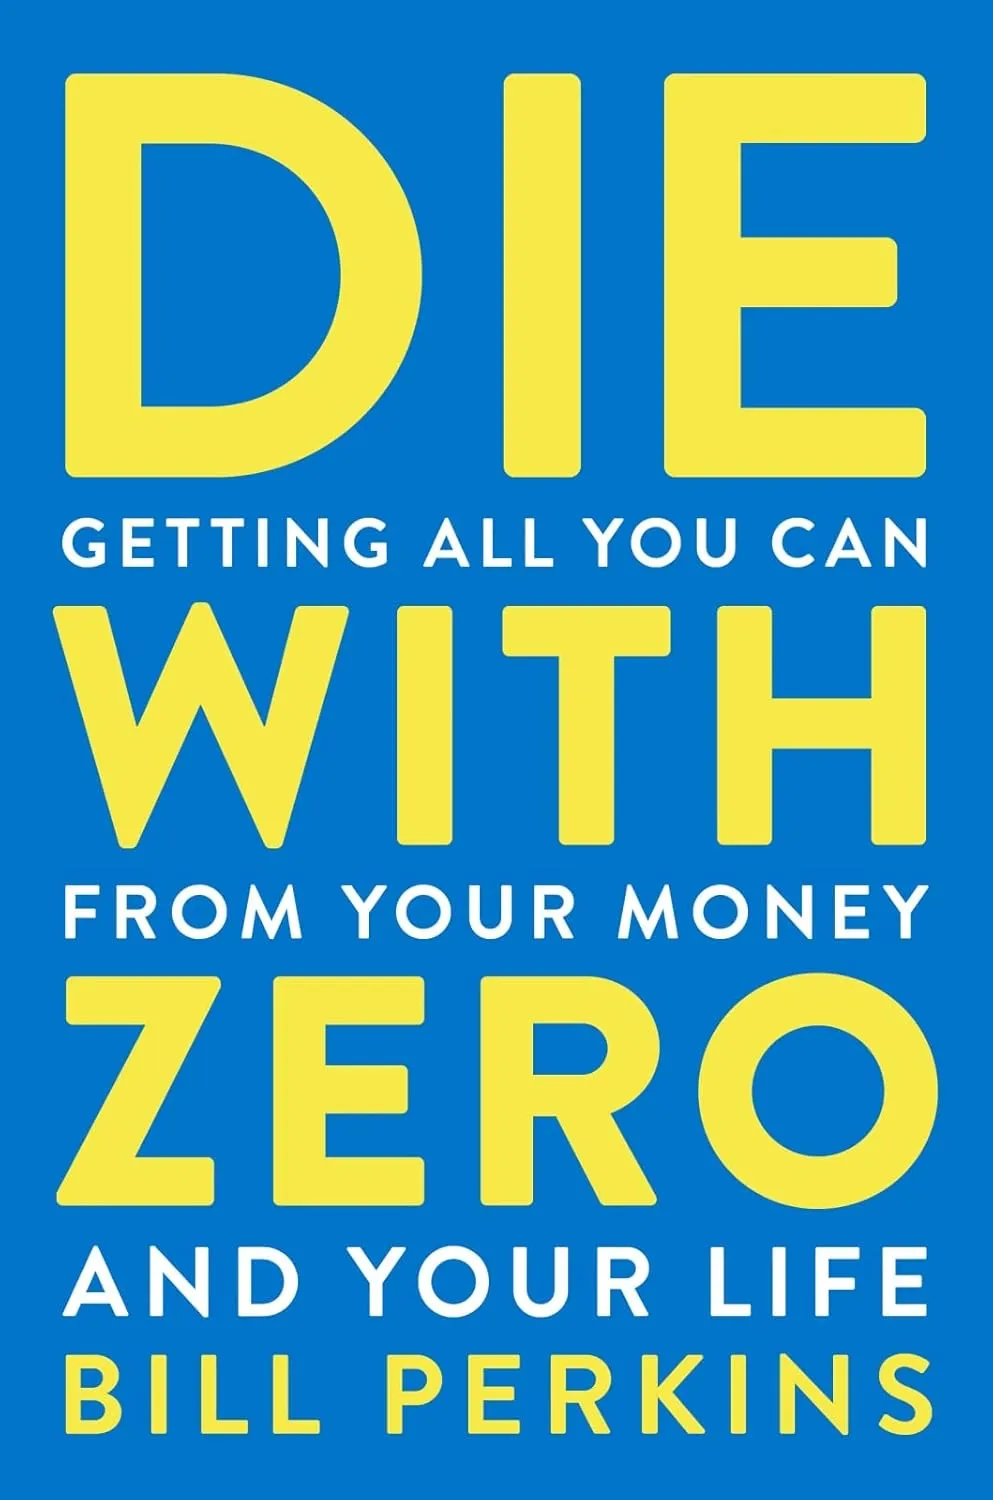
| Die With Zero | High | Low | Low-Medium |
Read Your Money or Your Life for the philosophical reframe. Read The Simple Path to Wealth for the investment mechanics. Read Die With Zero for the counterargument (spend your money while you can enjoy it).
Implementation Guide
Applying the Program in 2026
Step 1: Calculate your real hourly wage
Step 2: Track every transaction for 90 days
Step 3: Apply the three questions
Step 4: Calculate your crossover point with updated withdrawal rates
Step 5: Build a modern investment portfolio
Step 6: Consider flexible withdrawal strategies
Step 7: Plan for meaning, not just money
Frequently Asked Questions
Q: Is the 2018 updated edition necessary?
A: Yes. The original 1992 edition recommends investing exclusively in Treasury bonds, which was appropriate in a 6-8% yield environment. The 2018 update incorporates index fund investing and reflects 25 years of FIRE community evolution. Get the 2018 version.
Q: What safe withdrawal rate should I use for the crossover point?
A: For a traditional 30-year retirement, 3.9-4.0% is appropriate (Morningstar's 2026 estimate). For FIRE with a 50-year horizon, use 3.0-3.3%. Bengen's updated 4.7% applies to 30-year retirements with diversified portfolios. If you are willing to adjust spending during downturns, flexible strategies can support 5%+ starting rates.
Q: What is the most important concept in the book?
A: The real hourly wage calculation and the life energy reframe. Once you calculate that your real hourly wage is $19/hour (not $35/hour), every purchase converts to hours of finite life, fundamentally changing the emotional calculus of spending decisions.
Q: Is this book for early retirees only?
A: No. The consciousness about money, the fulfillment curve, and the life energy framework are valuable at any age and for any financial situation. The crossover point applies even if you achieve it at 65 rather than 45.
Q: How does healthcare factor into the crossover point?
A: If you retire before 65 (Medicare eligibility), add $9,600+ annually to your expenses for marketplace insurance. At a 3.5% withdrawal rate, this adds $274,000 to your crossover point portfolio. This is the single largest expense the book fails to address.
Final Verdict
Rating: 4.5/5
Your Money or Your Life is the most philosophically important personal finance book ever written. Its life energy reframe, the fulfillment curve, and the crossover point concept have launched more financial independence journeys than any other single work. The investment section needs updating for 2026 withdrawal rate research, and the book completely ignores healthcare costs for early retirees, which can add $274,000+ to the FIRE number. But the core philosophy is timeless. The tracking exercise alone, if actually done for 90 days, will change your relationship with money permanently.
Get Your Copy
Paperback: Buy on Amazon
Kindle: Buy on Amazon
Audiobook: Buy on Amazon
Prices current as of publication date. Free shipping available with Prime.