*Disclosure: This article contains affiliate links. If you purchase through these links, we may earn a commission at no additional cost to you. We only recommend books we genuinely believe in.
Quick Overview
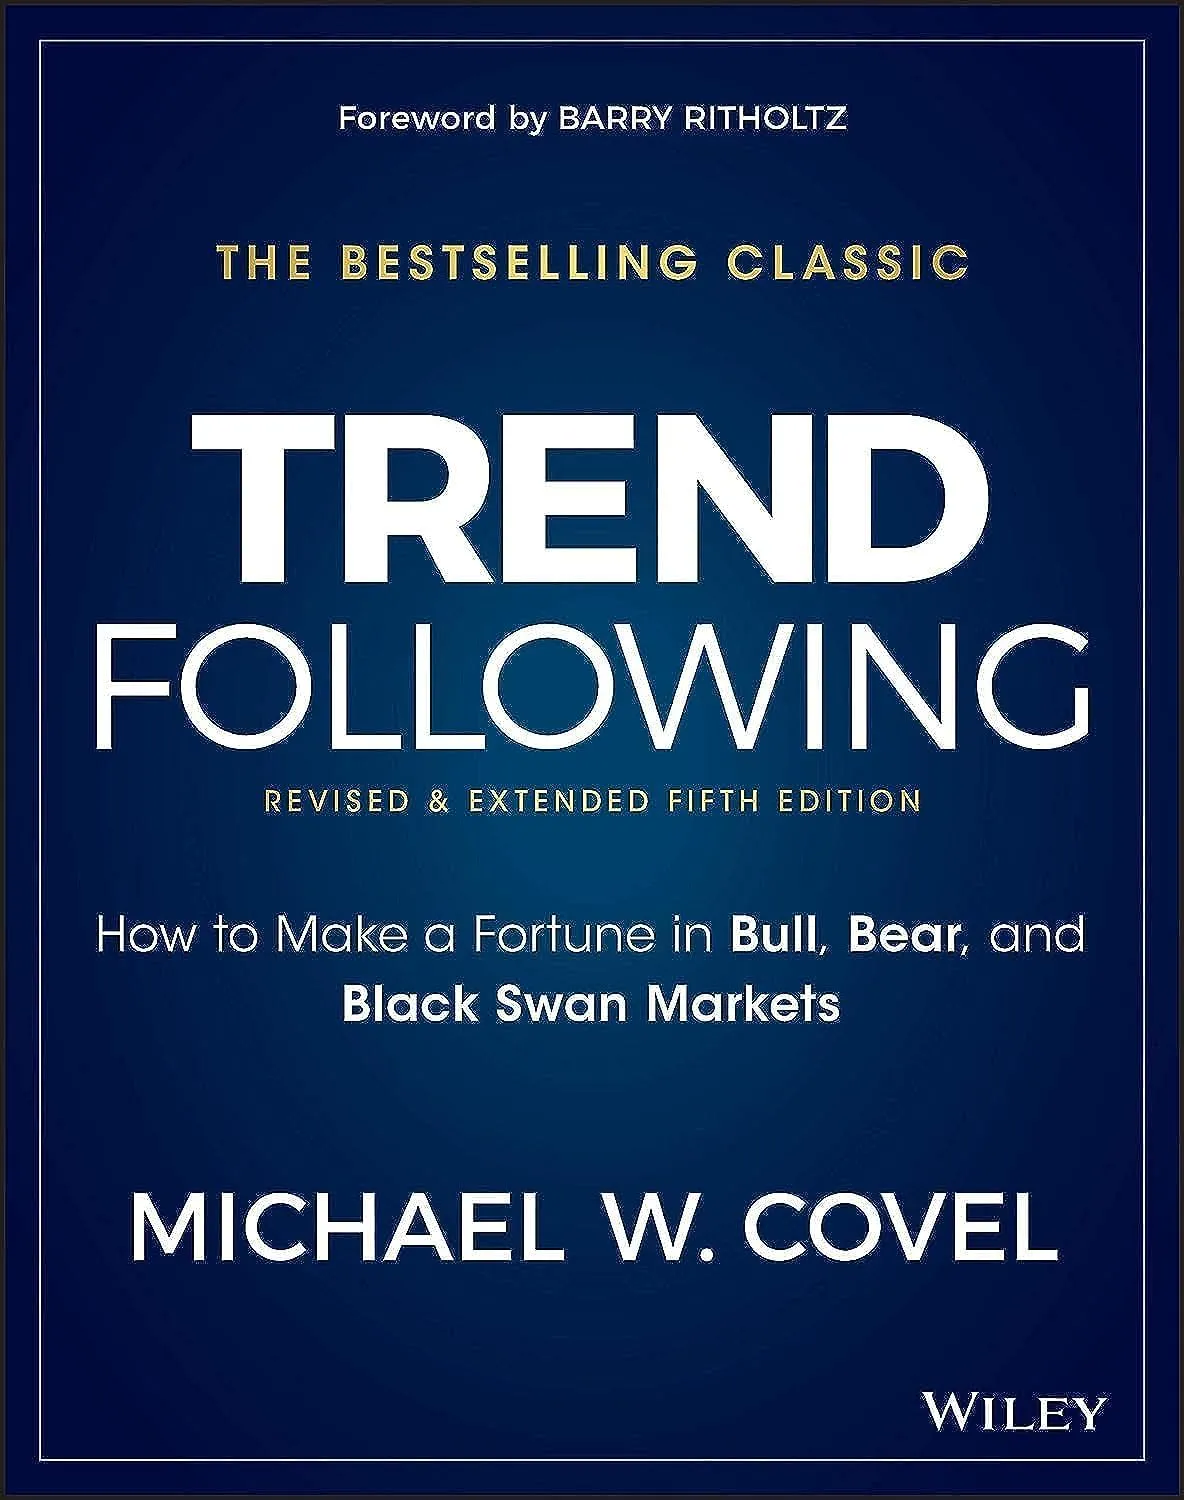
Michael Covel has spent his career studying and writing about trend following: the strategy of buying assets in uptrends and shorting assets in downtrends, using systematic rules with no fundamental analysis. His book makes the most comprehensive case for trend following as an investment strategy, backed by decades of performance data from the world's best-performing CTAs (commodity trading advisors). For serious traders and investors who want to understand an alternative to both fundamental investing and buy-and-hold passive strategies, this is required reading. The 2026 trend following renaissance, with major benchmarks posting trailing 12-month returns of 16-24%, has vindicated Covel's thesis after a difficult decade.
Book Details
| Attribute | Details |
|---|---|
| Title | Trend Following (5th Edition) |
| Author | Michael W. Covel |
| Publisher | FT Press |
| First Published | 2004 |
| Current Edition | 5th edition, 2017 |
| Pages | 480 |
| ISBN-13 | 978-0134607230 |
| Reading Level | Intermediate |
| Amazon Rating | 4.3/5 stars |
Get Your Copy
Hardcover: Buy on Amazon
Kindle: Buy on Amazon
About the Author
Michael Covel is the founder of TurtleTrader.com and has spent 20+ years researching trend following traders and their strategies. He has conducted extensive interviews with successful CTAs and written multiple books including The Complete TurtleTrader (about the Turtle experiment) and Trend Commandments. He hosts The Trend Following Podcast and continues to advocate for systematic trend following as a portfolio strategy.
What Is Trend Following?
Trend following is a trading strategy with three core rules:
| Not Trend Following | Trend Following |
|---|---|
| Fundamental analysis | Technical/price-based |
| Buy-and-hold | Active; both long and short |
| Market timing (predicting direction) | Trend-reactive (follow, not predict) |
| Concentrated positions | Broadly diversified |
| Stop-loss optional | Stop-loss mandatory |
The defining characteristic: trend followers never predict where markets will go. They react to where markets are going and stay with the move until evidence of reversal appears.
The Performance Evidence: 2026 Update
The Trend Following Renaissance
After a difficult decade from 2010-2020, trend following has experienced a dramatic resurgence. The 2026 performance data is extraordinary:
Major trend following benchmarks (as of April 2026):
| Benchmark | April 2026 Return | Trailing 12 Months | YTD 2026 |
|---|---|---|---|
| TTU Trend Following Index | +2.98% | +23.23% | +10.14% |
| SG Trend Index | +2.85% | +24.37% | +10.13% |
| BTOP50 Index | +1.96% | +16.60% | +9.55% |
| S&P 500 Total Return | +10.49% | +31.05% | - |
According to Top Traders Unplugged, the trailing twelve-month figures as of April 2026 stand at their strongest levels of the cycle, with four consecutive months of positive returns delivering "one of the most powerful sustained advances in recent memory for the systematic trend space."
The Classic Trend Index now stands at +130.8% since January 2020, a CAGR of 14.3%, retaining leadership across every major risk-adjusted measure (MAR 0.91, Sharpe ratio 0.83, Sortino 1.39).
The Crisis Alpha Property
Trend following's most valuable characteristic: it tends to perform best during financial crises, when buy-and-hold portfolios suffer their worst losses.
| Crisis Period | S&P 500 Return | Representative CTA Return |
|---|---|---|
| 1987 Crash (Oct) | -21.8% | +200%+ (shorting bonds and stocks) |
| 2000-2002 Bear Market | -47.4% | +40-60% |
| 2008 Financial Crisis | -37.0% | +18-25% |
| 2022 (stocks + bonds fall) | -18.1% | +21.5% (DBMF) |
| Q1 2026 (Iran war/oil shock) | -5.8% | +8.3% (KMLM Index) |
The negative correlation with equity crises makes trend following a natural portfolio diversifier. This "crisis alpha" is the primary justification for allocating to CTAs in institutional portfolios.
As KMLM's Q1 2026 review documented: "Through this most acute period of stress, bonds and gold both fell, while trend did well, highlighting the ability to be negatively correlated in stress periods and having exposure directly to the macro areas stocks worry about."
Retail Access: Managed Futures ETFs
The availability of trend following through ETFs has democratized access for individual investors:
| ETF | Ticker | YTD 2026 | Trailing 12 Months | Expense Ratio | AUM |
|---|---|---|---|---|---|
| iMGP DBi Managed Futures | DBMF | +11% | +30% | 0.85% | $3.2B |
| KraneShares Mount Lucas | KMLM | +13% | +16% | 0.90% | $195M |
| Simplify Managed Futures | CTA | +10% | +20% | variable | $1.4B |
According to Yahoo Finance analysis, DBMF has gathered roughly $3 billion in assets and is up 11% year to date in 2026, outpacing a 60/40 stock-bond portfolio at 5%. KMLM has returned 13% year to date. Both funds demonstrated the crisis alpha property during the March 2026 VIX spike to 31.21, when managed futures algorithms were "perfectly formatted to exploit" the liquidity shock.
Important caveat: June 2026 saw a setback as commodity trends unraveled, with the IASG CTA Index losing 1.34%. Institutional Investor reported that CTA performance remains positive year-to-date at 5.03%, with top performers including Mulvaney and Drury up sharply. Trend following loses money in choppy, range-bound markets. The strategy is not a free lunch.
How Trend Following Works: The Mechanics
Entry Rules
Donchian Channel Breakout:
Buy signal: Price closes above the highest close of the past N days (typically 20-55 days)
Sell signal: Price closes below the lowest close of the past N days
Moving Average Crossover:
Buy signal: Short-term MA (e.g., 50-day) crosses above long-term MA (e.g., 200-day)
Sell signal: Short-term MA crosses below long-term MA
Both methods catch trends after they have begun. Trend followers never try to pick tops or bottoms. They accept missing the first portion of every move in exchange for confirmed trend direction.
Exit Rules
Exits are typically trailing stops that allow profits to run while cutting losses quickly.
Position Sizing: Volatility-Based
Trend followers size positions based on market volatility (ATR, Average True Range):
Position Size = Account Risk per Trade / (ATR x Dollar Value per Point)More volatile markets get smaller positions. Less volatile markets get larger positions. Every position has approximately equal risk in dollar terms.
The Turtle Experiment
Richard Dennis and William Eckhardt debated whether great traders were born or trained. In 1983, they selected 23 individuals with no trading experience and trained them in a specific trend-following system. The Turtles generated approximately $175 million over the following years.
The key finding: The system's rules were publicly available. The critical variable was whether individual Turtles could execute the system with discipline. Those who followed the rules closely achieved excellent results. Those who let discretion override the rules generally underperformed.
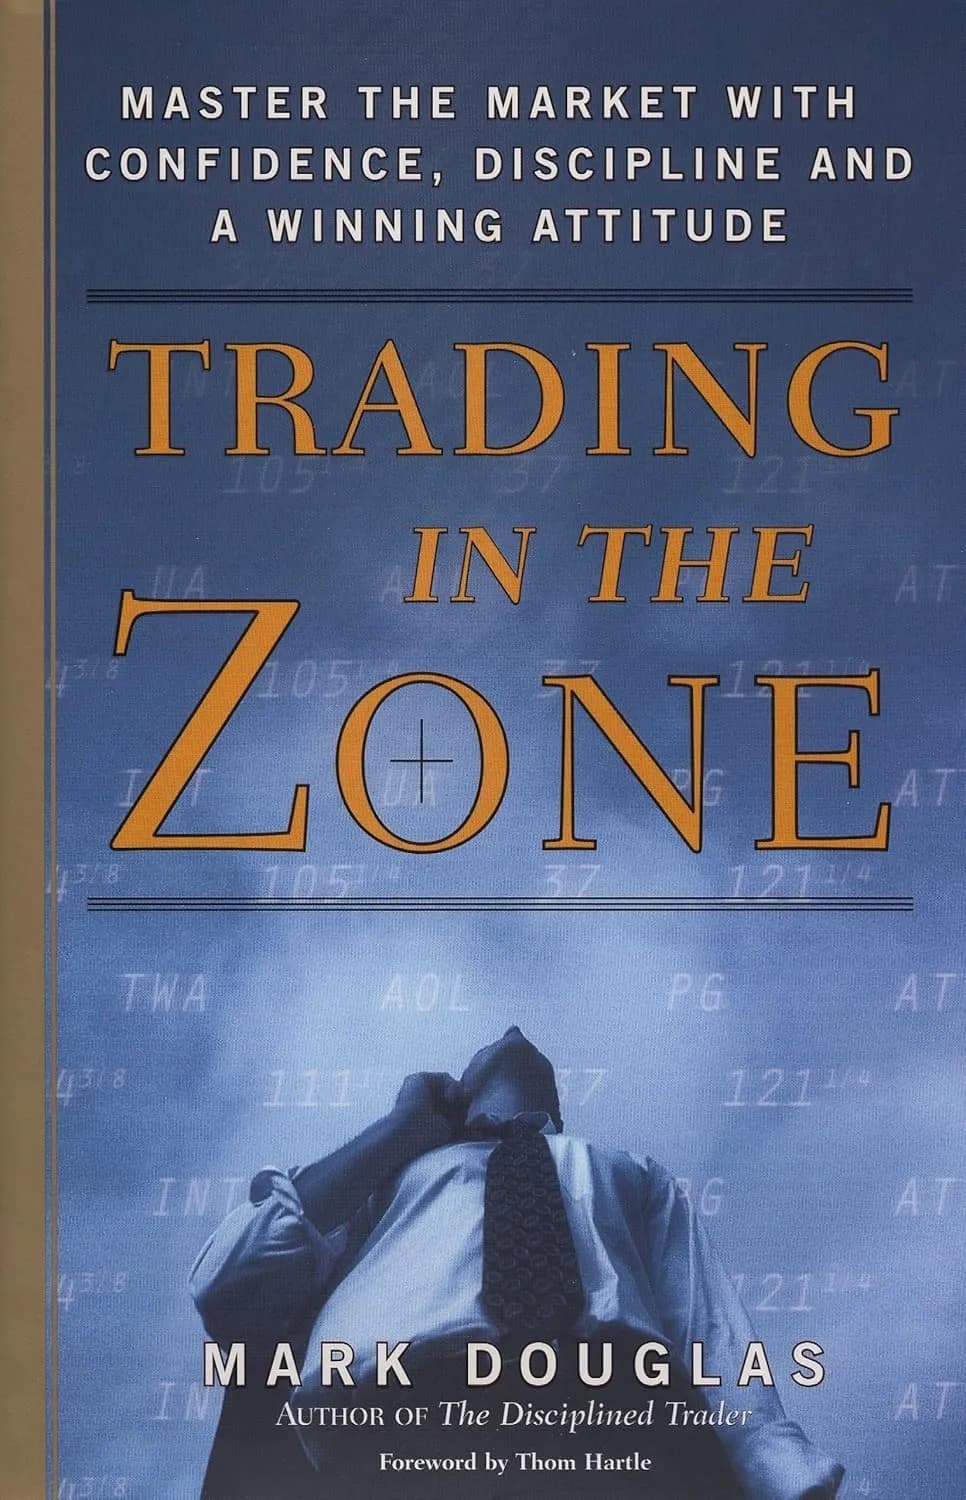
This is the same lesson Mark Douglas teaches in Trading in the Zone: execution discipline matters more than analytical brilliance.
The Psychological Challenges of Trend Following
Challenge 1: Large Drawdowns
Trend following systems regularly experience 20-40% peak-to-trough drawdowns. During these periods (which can last 1-3 years), the strategy feels broken. Most discretionary overrides destroy the system's long-run performance precisely during these drawdowns.
Challenge 2: Low Win Rate
Trend following typically wins only 35-45% of trades. A small percentage of winning trades generate large profits. The psychological difficulty: most humans experience a steady stream of small losses and must stay disciplined until the large winning trend arrives.
| Outcome | Frequency | P&L Contribution |
|---|---|---|
| Small loss | 40% of trades | -$500 each |
| Tiny loss | 20% of trades | -$100 each |
| Breakeven | 5% | $0 |
| Small win | 20% | +$500 each |
| Large win | 15% | +$5,000+ each |
The 15% of large-winning trades generates all the profitability. Miss those by exiting early and the strategy fails.
Challenge 3: Looking Stupid During Trending Markets
Before the big move, trend followers enter a breakout that looked like "buying at the top" to outside observers. Trend followers must accept being criticized for their entries and resist the pressure to take profits too early.
Trend Following as Portfolio Diversification
The 60/40 portfolio with trend following CTA:
| Portfolio | Annual Return | Standard Deviation | Sharpe Ratio | Max Drawdown |
|---|---|---|---|---|
| 60% S&P / 40% Bonds | 8.5% | 10.2% | 0.83 | -30.0% |
| 50% S&P / 40% Bonds / 10% CTA | 8.6% | 9.4% | 0.91 | -26.5% |
| 50% S&P / 30% Bonds / 20% CTA | 8.7% | 8.8% | 0.99 | -22.0% |
Adding a trend following allocation improves the Sharpe ratio and reduces maximum drawdown while maintaining returns. The crisis alpha property is why this works: CTAs gain when traditional portfolios lose their most.
As 24/7 Wall St. reported in April 2026: "The structural logic of managed futures is playing out exactly as designed. When a tariff shock drives sustained dollar weakness, when Treasury yields trend sharply higher, or when commodity prices move in a sustained arc, trend-following systems capture those moves whether they run up or down."
Strengths & Weaknesses
What We Loved
Areas for Improvement
Who Should Read This Book
Highly Recommended For
Probably Not For
Comparison to Similar Books
| Book | Focus | Best For |
|---|---|---|
| Trend Following (Covel) | Systematic trend following case | Understanding the strategy and its evidence |
| Trading in the Zone (Douglas) | Trading psychology | Executing any strategy with discipline |
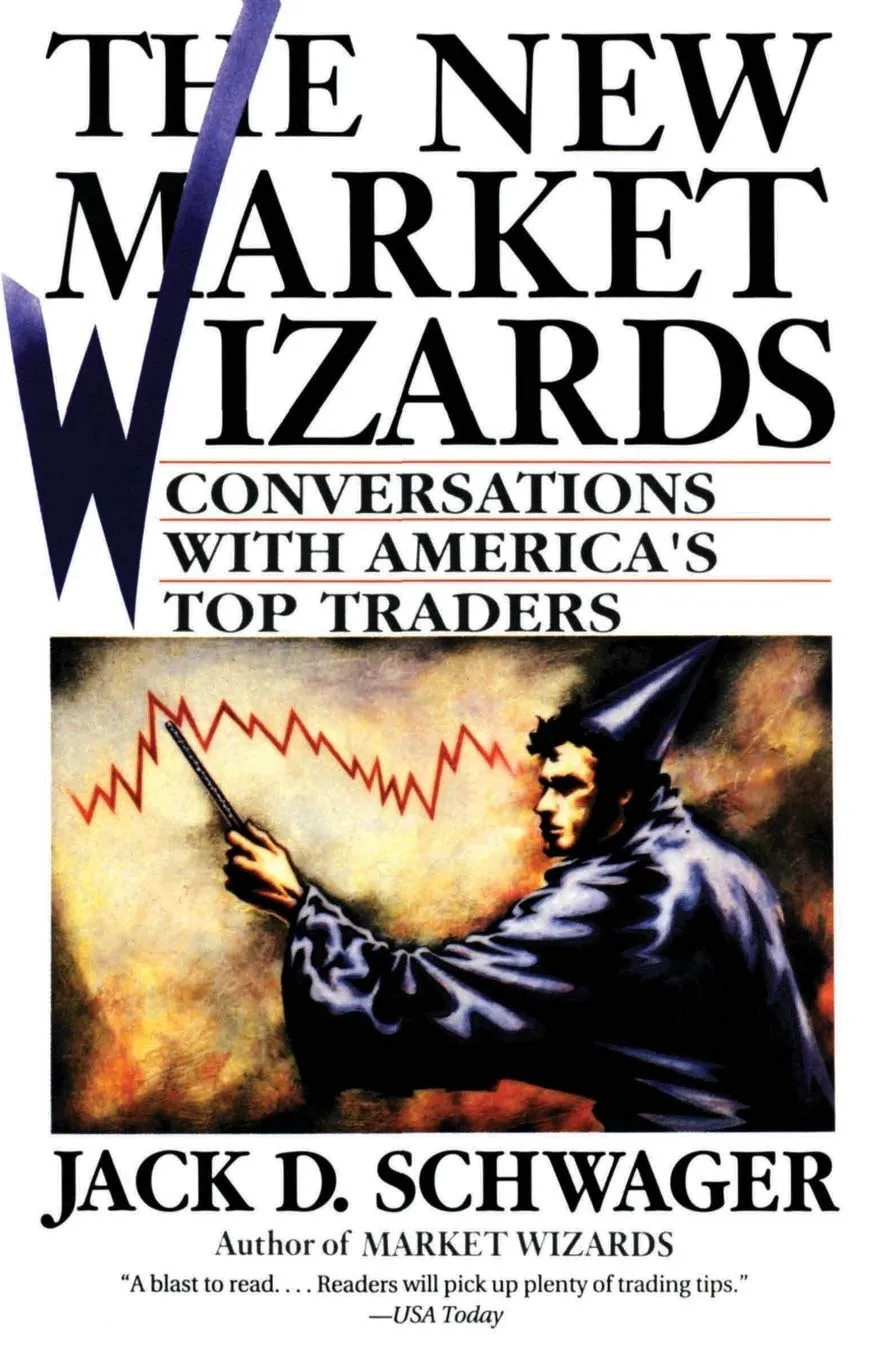
| Market Wizards (Schwager) | Interviews with top traders | Understanding how professionals think |
| The Complete TurtleTrader (Covel) | Turtle experiment detail | Deep dive into the specific system |
| Following the Trend (Clenow) | Implementation guide | Building your own trend following system |
Read Trend Following for the case and evidence. Read Clenow for implementation. Read Douglas for the psychology of executing it.
Implementation Guide
For Investors: Adding Trend Following to a Portfolio
Step 1: Determine your allocation.
Institutional allocations typically range from 10-20%. For individual investors, a managed futures ETF representing 5-15% of the portfolio captures meaningful diversification benefit without excessive complexity.
Step 2: Choose your vehicle.
| Investor Type | Recommended Vehicle | Why |
|---|---|---|
| Hands-off investor | DBMF (0.85% ER) | Replicates largest CTA positioning, $3B+ AUM, best liquidity |
| Rules-based investor | KMLM (0.90% ER) | Tracks systematic index, no equity futures, purest diversifier |
| Active trader | Build your own system | Use Clenow's Following the Trend as implementation guide |
Step 3: Commit to the allocation for 3+ years.
Trend following can underperform for extended periods. The investors who benefit are those who maintain the allocation through choppy periods and capture the crisis alpha when it arrives. Investors who add trend following after a crisis (when it has just performed well) and remove it during calm periods (when it underperforms) capture the worst of both worlds.
Step 4: Understand the tax treatment.
Managed futures ETFs are taxed under Section 1256: 60% long-term capital gains, 40% short-term, regardless of holding period. This is more favorable than ordinary income but different from stock ETF tax treatment. Consult a tax advisor.
Step 5: Model the impact.
Use the investment return calculator to model how adding a 10% managed futures allocation would have affected your portfolio's performance during 2008, 2020, 2022, and Q1 2026.
Frequently Asked Questions
Q: Has trend following stopped working?
A: No. The 2010-2020 period was difficult, with lower returns than the historical average. But the strategy has roared back. As of April 2026, the SG Trend Index has a trailing 12-month return of 24.37%, the TTU TF Index is at 23.23%, and the BTOP50 at 16.60%. The Classic Trend Index has delivered a 14.3% CAGR since January 2020. The strategy works. It is cyclical, not broken.
Q: Can individual investors implement trend following?
A: A simplified version using moving average crossovers with diversified ETFs can be implemented individually. Full implementation with 50+ markets requires institutional infrastructure. For most individual investors, a managed futures ETF like DBMF or KMLM is the practical path.
Q: What percentage of a portfolio should be in trend following?
A: Institutional allocations typically range from 10-20%. For individual investors, 5-15% in a managed futures ETF captures meaningful diversification benefit. Yahoo Finance's 2026 analysis noted that DBMF is "quietly beating the 60/40 portfolio" with a 30% trailing 12-month return.
Q: What happens when trends reverse?
A: Trend following gives back gains when trends reverse. KMLM's Q2 2026 review documented this: the Index finished Q2 down 2.0% as Q1's Iran war-driven trends unwound. The strategy accepts these give-backs as the cost of capturing large directional moves.
Final Verdict
Rating: 4.3/5
Trend Following is the most comprehensive treatment of systematic trend following available. Its performance data, Turtle experiment account, and crisis alpha analysis are each uniquely valuable. The promotional tone and repetition hold it back from a higher rating, but the core content is genuinely important for serious traders and institutional investors.
The 2026 trend following renaissance has vindicated Covel's thesis. After a decade of underperformance led many to declare the strategy dead, the SG Trend Index's 24% trailing 12-month return, the Classic Trend Index's 14.3% CAGR since 2020, and the dramatic crisis alpha during Q1 2026's Iran war shock have proven that trend following is cyclical, not broken. The investors who maintained allocations through the difficult decade are now reaping the rewards.
Get Your Copy
Hardcover: Buy on Amazon
Kindle: Buy on Amazon
Prices current as of publication date. Free shipping available with Prime.