*Disclosure: This article contains affiliate links. If you purchase through these links, we may earn a commission at no additional cost to you. We only recommend books we have personally read and genuinely believe in.
Quick Overview
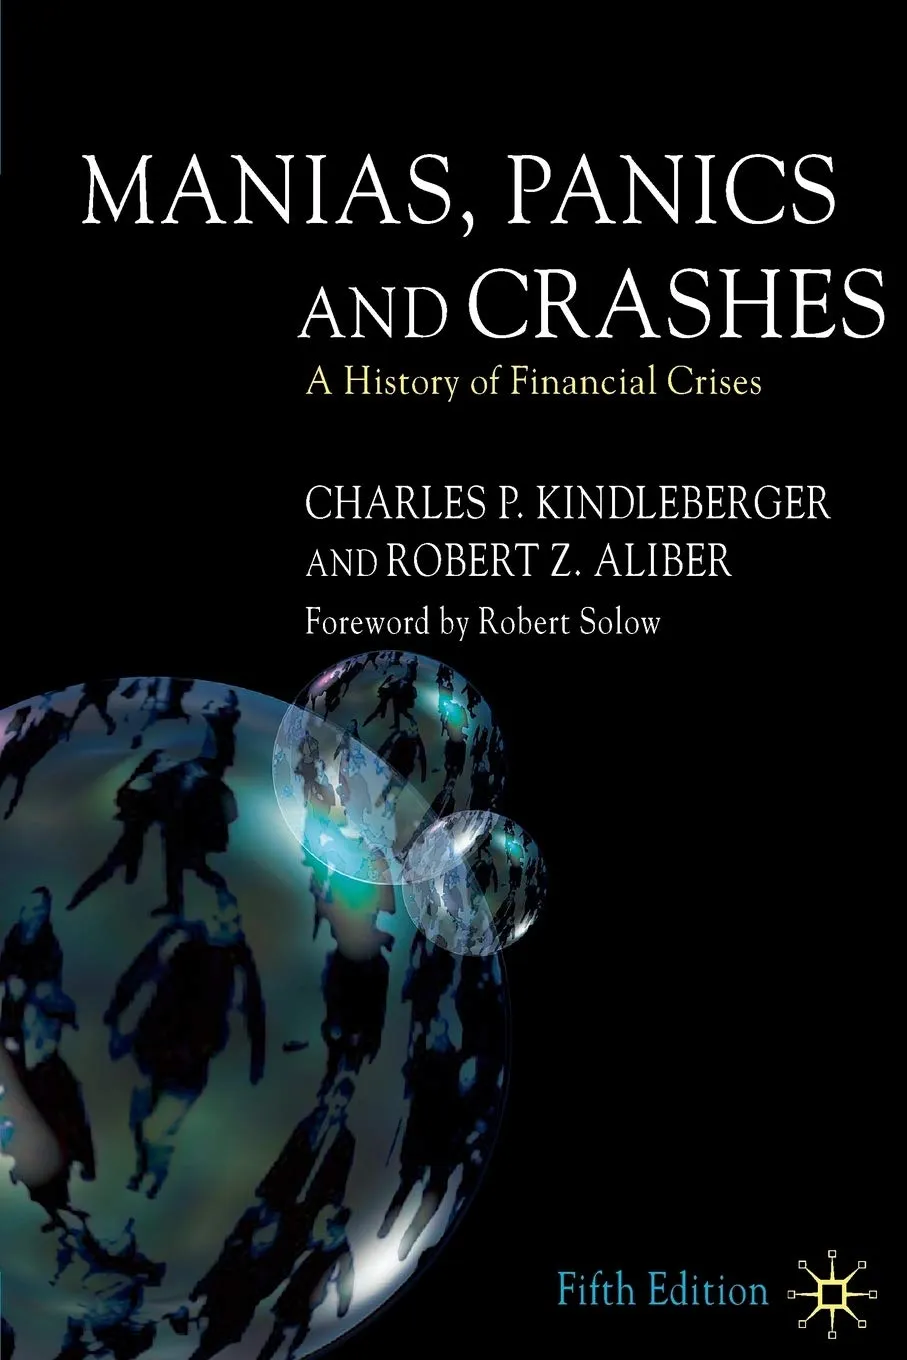
Hyman Minsky argued that stability itself creates instability. Extended periods of economic calm encourage risk-taking that eventually produces crisis. Charles Kindleberger took Minsky's theory and applied it to five centuries of financial history: tulips in the 1630s, the South Sea Bubble in 1720, railroad manias in the 1840s, the 1929 crash, and dozens more. The result is a book that demonstrates, with exhausting historical evidence, that speculative manias follow a consistent five-stage pattern regardless of the specific asset or era. The 2023 collapse of Silicon Valley Bank fit the Minsky-Kindleberger model so precisely that it could serve as a textbook case study. First published in 1978 and updated through seven editions, this remains the scholarly foundation for understanding why financial crises keep happening and why "this time is different" is always wrong.
Book Details
| Attribute | Details |
|---|---|
| Title | Manias, Panics, and Crashes |
| Author | Charles P. Kindleberger (updated by Robert Z. Aliber) |
| Publisher | Palgrave Macmillan |
| First Published | 1978 |
| Current Edition | 7th edition, 2015 |
| Pages | 352 |
| Reading Level | Intermediate to Advanced |
| Amazon Rating | 4.5/5 stars |
Get Your Copy
Paperback: Buy on Amazon
Kindle: Buy on Amazon
About the Author
Charles Kindleberger (1910-2003) was Ford Professor of Economics at MIT for decades and one of the foremost historians of international economics. He helped design the Marshall Plan after World War II. His other books include The World in Depression (1986) and A Financial History of Western Europe (1984).
His background matters for evaluating this book. Kindleberger was not a theorist who constructed models and tested them with data. He was an economic historian who read everything and synthesized patterns from the historical record. This makes the book richer in detail than any theoretical treatment could be, but also means the argument rests on narrative evidence rather than statistical proof. If you want formal models of financial crises, read Minsky's own work. If you want 500 years of crisis episodes organized into a coherent framework, read Kindleberger.
The Minsky Model
Kindleberger applies Hyman Minsky's theory of financial instability to historical crises. Minsky (1919-1996) argued that stability itself creates instability. Extended periods of economic stability encourage risk-taking that eventually produces crisis.
The Five Stages of a Financial Crisis
Stage 1: Displacement
An external shock changes the economic outlook. This may be:
The displacement creates genuine new profit opportunities. Early movers profit substantially and legitimately.
Stage 2: Boom
Credit expands. Investment increases. Early investors prosper and attract followers. Asset prices rise, which validates the thesis, which attracts more investment.
| Indicator | Normal | Boom |
|---|---|---|
| Credit growth | 4-6% annually | 15-30% annually |
| Asset price growth | 3-7% annually | 20-50% annually |
| Debt-to-income ratios | Stable | Rising rapidly |
| New entrants to market | Modest | Surging |
Stage 3: Euphoria
The boom transitions to euphoria. Caution is abandoned. Asset prices detach from fundamental values. The specific hallmarks Kindleberger identifies:
Historical examples of "this time is different" narratives:
| Era | Asset | Justification |
|---|---|---|
| 1637 | Tulips | Rare bulbs, new luxury market, aristocratic demand |
| 1720 | South Sea Company | Trade monopoly with the Americas |
| 1840s | Railroads | New transportation technology changes everything |
| 1929 | Stocks | Permanent prosperity, new era of American capitalism |
| 1989 | Japan (land/stocks) | Japanese management system is superior |
| 2000 | Internet stocks | Internet changes all valuation rules |
| 2007 | Housing | Home prices cannot decline nationally |
| 2021 | Crypto/SPACs | Digital assets and zero-interest rate era |
Stage 4: Distress
Some insiders begin selling. The rate of credit expansion slows. Some participants can no longer service their debts. The first visible defaults begin.
The critical phase: distress can resolve itself (soft landing) if it is isolated and credit remains available. It escalates to crisis if confidence collapses.
Stage 5: Revulsion
A triggering event collapses confidence. It need not be a large event. The system is already fragile. Credit contracts sharply. Asset prices fall to levels below fundamental value. Forced selling by leveraged participants accelerates the decline.
| Crisis | Trigger |
|---|---|
| 1637 Tulip Mania | Auction failure in Haarlem |
| 1720 South Sea Bubble | Company insiders selling |
| 1929 Crash | Margin calls; bank failures |
| 1987 Crash | Program trading; portfolio insurance |
| 1997-98 Asian Crisis | Thai baht devaluation |
| 2008 Crisis | Bear Stearns hedge funds collapse |
| 2020 (COVID) | Pandemic declaration and uncertainty |
| 2023 SVB | $42 billion deposit withdrawal in one day |
Five Centuries of Crises: The Historical Evidence
The Tulip Mania (1634-1637)
Kindleberger's account of the Dutch tulip mania is the most thoroughly documented commodity speculation in history.
| Year | Price of Semper Augustus bulb (in Dutch guilders) |
|---|---|
| 1624 | 1,200 |
| 1633 | 5,500 |
| 1636 (peak) | ~13,000 |
| February 1637 | Prices collapsed to near zero |
At peak, a single tulip bulb cost more than a skilled craftsman earned in a decade. The mania involved futures contracts on bulbs not yet planted: pure speculation detached from any underlying value.
The lessons from tulip mania translate directly to modern markets. Any scarce item can become the object of speculative mania. Futures markets amplify speculation beyond the supply of the underlying asset. The collapse is typically faster than the buildup. Participants universally believe they will identify the peak and exit in time. They almost never do.
The South Sea Bubble (1720)
The South Sea Company was granted a monopoly on British trade with South America. The actual trade was minimal. The company's directors issued stock to pay off the British government debt, creating a new source of permanent income, or so they claimed.
| Month | Price (in pounds) |
|---|---|
| January 1720 | 120 |
| May 1720 | 500 |
| June 1720 | 900 |
| August 1720 (peak) | 1,000 |
| December 1720 | 150 |
Isaac Newton famously lost 20,000 pounds in the collapse, a significant portion of his life savings. He reportedly said: "I can calculate the motion of heavenly bodies, but not the madness of people."
The lessons: government debt structures can become objects of speculation. Financial complexity creates confusion that enables fraud. Even the greatest minds are not immune to speculative fever. The promoters enriched themselves while retail investors bore the losses.
The Railroad Manias (1840s, 1860s, 1890s)
Railroads were the genuinely transformative technology of the 19th century, equivalent in economic impact to the internet. They also produced multiple distinct speculative manias.
Between 1844 and 1846, British Parliament approved 9,000 miles of new railway lines. At peak mania, railway shares traded at prices implying returns that assumed all traffic would shift to rail immediately. By 1847, most newly issued railway shares had lost 50-85% of their value.
The pattern is the one that repeats in every technology mania: the railroads were genuinely transformative, and the stocks were speculative. Both can be true simultaneously. Correct thesis, incorrect valuation. This is exactly what happened with internet stocks in 1999 and crypto in 2021.
The 2023 Banking Crisis: A Minsky Model Case Study
The collapse of Silicon Valley Bank in March 2023 fits the Kindleberger-Minsky framework with remarkable precision. A Yale University analysis by Andrew Metrick documents the sequence:
| Minsky Stage | SVB Timeline |
|---|---|
| Displacement | 2020-2021: Zero interest rates, massive tech sector deposit growth |
| Boom | SVB deposits tripled from $62B to $173B (2020-2021); invested heavily in long-term Treasuries and MBS |
| Euphoria | No hedging of interest rate risk; CRO position vacant for most of 2022; regulatory exemptions assumed |
| Distress | 2022: Fed raised rates from 0% to 4.25%; unrealized losses on securities reached $17B |
| Revulsion | March 9, 2023: $42 billion withdrawn in a single day; regulators closed the bank mid-day Friday |
SVB was insolvent on a mark-to-market basis by December 2022. The equity cushion of $15 billion was wiped out by $17 billion in unrealized securities losses. But nothing happened until March 8, 2023, when SVB announced it had sold $24 billion of securities at a $1.8 billion loss and would raise capital. That announcement was the triggering event that Kindleberger describes: not a large event itself, but enough to collapse confidence in an already fragile system.
The Federal Reserve responded as lender of last resort, invoking the systemic risk exception and creating the Bank Term Funding Program (BTFP) to provide loans against government securities at par value. This is exactly what Kindleberger argued for throughout the book. The 1929-33 Fed failed to act as lender of last resort, and a severe recession became the Great Depression. The 2023 Fed acted within 48 hours, and the panic was contained.
A 2025 study in the Journal of Banking Regulation notes that social media-driven bank runs represent a new phenomenon. SVB depositors withdrew $42 billion in a single day, accelerated by Twitter and Slack conversations among venture capitalists. Traditional bank run models assumed physical lines at teller windows. The speed of digital bank runs makes the lender of last resort function even more critical: regulators must act in hours, not days.
The Lender of Last Resort Question
Kindleberger's most controversial argument: financial crises require a lender of last resort, a credible institution willing to provide unlimited liquidity during panics to prevent revulsion from becoming depression.
| Crisis | Lender of Last Resort | Outcome |
|---|---|---|
| 1847 UK | Bank of England (suspended gold standard temporarily) | Crisis contained |
| 1907 US | JP Morgan (private; no central bank yet) | Crisis contained |
| 1929-33 US | None (Fed contracted money supply) | Great Depression |
| 1987 US | Federal Reserve (Greenspan promised liquidity) | Crisis contained in one day |
| 1998 LTCM | Federal Reserve-organized private bailout | Crisis contained |
| 2008 US | Federal Reserve + Treasury (TARP) | Crisis contained but severe recession |
| 2023 US | Federal Reserve (BTFP, systemic risk exception) | Crisis contained within days |
The 1929-33 contrast with 1987 is Kindleberger's most important evidence. The Fed's failure to act as lender of last resort in 1931 (when European banks failed and transmitted crisis globally) turned a severe recession into the Great Depression. In 1987, Greenspan promised liquidity immediately, and the crisis was contained in one day.
Critics argue that consistent government bailouts create moral hazard: institutions take greater risks knowing they will be rescued. Kindleberger acknowledges this tension but argues the alternative (allowing panics to run their course) produces greater economic damage. The 2023 SVB response illustrates the trade-off: uninsured depositors were protected, which contained the panic but also reinforced the expectation that large depositors will be bailed out.
Identifying Where We Are in the Cycle
Kindleberger's framework provides a checklist for assessing current market conditions.
Displacement Checklist
Euphoria Checklist
| Indicator | Normal | Euphoric |
|---|---|---|
| "This time is different" in mainstream media | Rare | Frequent |
| New valuation metrics invented | No | Yes |
| Leverage ratios | Historical norms | Well above norms |
| New retail investor participation | Modest | Surging |
| Short sellers vilified | No | Yes |
| Skeptics fired or marginalized | No | Common |
Distress Checklist
The investor response to each stage:
| Stage | Optimal Response |
|---|---|
| Displacement | Identify and allocate to the genuine opportunity |
| Boom | Participate but reduce leverage; monitor euphoria indicators |
| Euphoria | Reduce exposure; take profits; avoid leverage entirely |
| Distress | Wait; hold cash; watch for signs of stage transition |
| Revulsion | Begin cautious accumulation of quality assets at distressed prices |
Strengths & Weaknesses
What We Loved
Areas for Improvement
Who Should Read This Book
Highly Recommended For
Probably Not For
Comparison to Similar Books
| Book | Focus | Approach | Readability |
|---|---|---|---|
| Manias, Panics, and Crashes | 500 years of crises | Minsky model applied to history | Medium |
| Irrational Exuberance (Shiller) | Bubble psychology | Behavioral finance | High |
| The Big Short (Lewis) | 2008 crisis | Narrative journalism | Very High |
| When Genius Failed (Lowenstein) | LTCM collapse | Narrative history | High |
| Animal Spirits (Akerlof & Shiller) | Behavioral macroeconomics | Theory + applications | Medium |
Read Manias, Panics, and Crashes for the historical framework. Read Irrational Exuberance for the behavioral psychology of bubbles. Read The Big Short for the 2008 story. Read When Genius Failed for how leverage destroyed a single fund.
Implementation Guide
How to Apply the Kindleberger-Minsky Framework
Step 1: Run the euphoria checklist on your current portfolio
Step 2: Monitor credit conditions
Step 3: Watch for insider selling
Step 4: Keep cash for the revulsion stage
Frequently Asked Questions
Q: Is the 7th edition necessary or is an older edition sufficient?
A: The core framework is in all editions. The later editions add chapters on subsequent crises (Asian crisis, dot-com, 2008). The 7th edition (2015) is best for currency, but none cover the 2023 SVB collapse. Our review above applies the framework to that crisis for you.
Q: How actionable is this framework for individual investors?
A: It provides context and pattern recognition rather than specific buy/sell signals. The euphoria checklist is the most actionable element. When you see multiple euphoria indicators simultaneously, the risk/reward of most assets has deteriorated significantly.
Q: Did the 2023 SVB crisis validate the Minsky model?
A: Yes, almost perfectly. SVB went through displacement (zero rates, deposit surge), boom (asset growth), euphoria (no hedging, vacant CRO), distress (rate hikes, unrealized losses), and revulsion ($42 billion withdrawal in one day). The Fed acted as lender of last resort within 48 hours, exactly as Kindleberger prescribed.
Q: What about AI stocks in 2025-2026? Is that a mania?
A: Run the euphoria checklist. New valuation metrics being invented? Leverage increasing? Skeptics being fired? Retail investors surging? The framework does not predict timing, but it tells you when the risk/reward has deteriorated. Make your own assessment.
Final Verdict
Rating: 4.5/5
Manias, Panics, and Crashes remains the essential historical and theoretical framework for understanding financial crises. The 2023 SVB collapse validated the Minsky-Kindleberger model yet again: displacement, boom, euphoria, distress, revulsion, all in a system that was insolvent for months before the triggering event. The Fed's response validated Kindleberger's lender of last resort argument. Every serious investor should read this book to understand the structural forces that produce crises and the consistent patterns that precede them. The main limitation is the lack of practical guidance for individual portfolio decisions, which our implementation guide above attempts to address.
Get Your Copy
Paperback: Buy on Amazon
Kindle: Buy on Amazon
Prices current as of publication date. Free shipping available with Prime.