*Disclosure: This article contains affiliate links. If you purchase through these links, we may earn a commission at no additional cost to you. We only recommend books we genuinely believe in.
Quick Overview
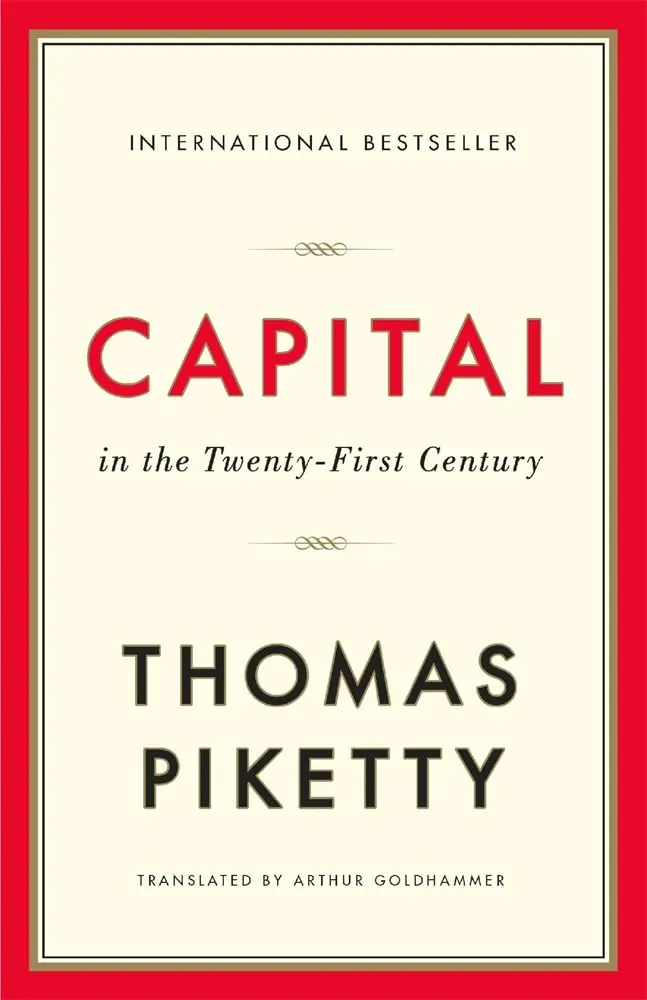
The top 0.1% of Americans now own more wealth than the bottom 50%. That statistic, which would have seemed impossible in the mid-20th century, is exactly the kind of trend Thomas Piketty predicted. Capital in the Twenty-First Century became a global publishing phenomenon in 2013: a 700-page work of academic economics that hit the New York Times bestseller list. Its central thesis is that when the return on capital (r) consistently exceeds economic growth (g), wealth concentrates progressively in the hands of those who own capital. Piketty traces this pattern across two centuries of data from France, Britain, Germany, and the United States, arguing that the relative equality of the mid-20th century was an aberration caused by the destruction of capital in two World Wars, not a permanent feature of capitalism.
Book Details
| Attribute | Details |
|---|---|
| Title | Capital in the Twenty-First Century |
| Author | Thomas Piketty |
| Publisher | Belknap Press / Harvard University Press |
| Published | French 2013; English translation 2014 |
| Pages | 696 |
| Reading Level | Advanced |
| Amazon Rating | 4.1/5 stars |
Get Your Copy
Hardcover: Buy on Amazon
Kindle: Buy on Amazon
About the Author
Thomas Piketty holds a Ph.D. in economics from the London School of Economics and EHESS. He declined the Legion d'honneur, saying he did not think it was the government's role to decide who was honorable. He has subsequently written Capital and Ideology (2019), extending his analysis with more data and stronger policy prescriptions, and A Brief History of Equality (2022), which argues that the long-run arc of history actually bends toward equality if you look at the right data.
His World Inequality Lab at the Paris School of Economics continues to produce the World Inequality Report, with the 2024 edition providing updated data on global wealth concentration that both confirms and extends the trends identified in Capital in the Twenty-First Century.
The Central Thesis: r > g
The Formula
Piketty's central argument is expressed as:
r > g

Where:
r = Return on capital (profits, dividends, interest, rents)
g = Rate of economic growth
When the return on invested capital consistently exceeds the economy's growth rate, the share of national income going to capital owners rises relative to the share going to labor. Wealth concentrates progressively.
The Historical Data
Piketty assembled an unprecedented historical dataset covering France, Britain, Germany, and the United States from the 18th century to the present.
The capital-to-income ratio (wealth / national income):
| Country | 1700 | 1910 | 1950 | 1970 | 2010 |
|---|---|---|---|---|---|
| France | ~700% | ~700% | ~250% | ~350% | ~600% |
| United Kingdom | ~700% | ~700% | ~250% | ~300% | ~550% |
| Germany | data gap | ~650% | ~200% | ~250% | ~450% |
| United States | ~300% | ~500% | ~380% | ~400% | ~450% |
The pattern: high capital-to-income ratios before WWI, dramatic compression during 1914-1945 (wars destroyed capital), recovery in the postwar period, and renewed increase toward pre-WWI levels by 2010.
A capital-to-income ratio of 700% means the total wealth of a country is worth 7 years of national income. When the return on this capital is 5% and economic growth is 1-2%, the capital share of income grows continuously.
The top wealth shares:
| Country | Top 10% wealth share (1910) | Top 10% wealth share (1950-70) | Top 10% wealth share (2010) |
|---|---|---|---|
| Europe | ~90% | ~60% | ~65% |
| United States | ~80% | ~65% | ~72% |
Wealth concentration fell dramatically in the mid-20th century and has been rising since the 1980s, though it has not yet reached pre-WWI levels. The World Inequality Report 2024 confirmed that this trend has continued, with the top 10% globally holding approximately 76% of all wealth and the bottom 50% holding just 2%.
Part I: Income and Capital
Defining Capital
Piketty uses "capital" broadly to include all non-human assets:
Capital's composition has changed dramatically. In 1700, agricultural land was the primary form of capital. By 2010, housing, financial assets, and business capital dominate. The total value has fluctuated but trended upward relative to national income over the long run.
The national accounting identity:
Beta = s / g

Where:
Beta = Capital-to-income ratio (wealth / national income)
s = Savings rate
g = Economic growth rate
When growth is slow (low g) and savings are substantial (high s), the capital-to-income ratio rises. This explains why the 21st century, with slowing population growth and productivity growth, may see rising wealth concentration even without war-level disruptions to reverse it.
The First Fundamental Law of Capitalism
Alpha = r x Beta

Where:
Alpha = Capital's share of national income
r = Return on capital
Beta = Capital-to-income ratio
If Beta = 600% and r = 5%, then Alpha = 30%. Capital claims 30% of national income, labor claims 70%.
As Beta rises toward pre-WWI levels and if r remains above g, Alpha increases. Capital claims a growing share of national income at the expense of labor income.
Part II: The Dynamics of the Capital/Income Ratio
The Second Fundamental Law of Capitalism
Beta* = s / g (in the long run)

Where:
Beta* = Long-run equilibrium capital-to-income ratio
s = Net savings rate
g = Long-run growth rate
With slow growth (g = 1%) and moderate savings (s = 10%), the long-run equilibrium capital-to-income ratio is:
Beta* = 10% / 1% = 10 (1000% of national income)This is higher than historical levels. If demographic and productivity trends push long-run growth toward 1-1.5%, and savings rates remain at historical levels, the capital-to-income ratio will continue rising.
A 2025 study published in the Journal of Income Distribution tested Piketty's second fundamental law using a larger sample of countries than Piketty's original four. The researchers found that while the law works reasonably well for developed economies with mature financial systems, it is "not generalizable" across all economies. In developing countries with different savings patterns, capital market structures, and growth dynamics, the relationship between savings, growth, and the capital-to-income ratio breaks down. This is an important caveat: Piketty's framework is strongest for the specific countries he studied and weaker as a universal law.
Why Growth Rate Matters Enormously
Piketty's most important insight: slow growth is the friend of inherited wealth and the enemy of earned income.
The compound effect of r > g:
| Scenario | r (capital return) | g (growth) | Effect |
|---|---|---|---|
| High growth era (1950-80) | 5% | 4-5% | r approximately equals g; wealth concentration stable |
| Low growth era (2000+) | 5% | 1-2% | r much greater than g; wealth concentration rising |
| Extreme slow growth | 4% | 0.5% | r far exceeds g; 19th-century levels |
A 5% return on capital means wealth doubles every 14 years. A 2% growth rate means the economy doubles every 35 years. Capital owners' wealth grows dramatically faster than the incomes of those who work. You can model this compounding effect yourself with our compound interest calculator.
The inheritance implication:
In a slow-growth economy, inherited wealth matters more than in a high-growth economy because the economy grows slowly (so starting with wealth is a larger relative advantage), capital returns remain robust (so wealth compounds rapidly), and meritocratic ascent through earned income is harder relative to the head start from inheritance.
Piketty estimates that the share of wealth attributable to inheritance (vs. earned savings) was 80-90% in the 19th century, fell to 40-50% in the mid-20th century, and is rising back toward 60-70% today. The World Inequality Report 2024 found that inherited wealth as a share of total wealth has continued to rise in advanced economies, consistent with Piketty's prediction.
Part III: The Structure of Inequality
Income vs. Wealth Inequality
These are related but distinct:
Income inequality measures the distribution of what people earn in a given year. The top 10% in the U.S. earn approximately 45-50% of all income.
Wealth inequality measures the distribution of accumulated assets. The top 10% in the U.S. own approximately 70-75% of all wealth.
Wealth is more concentrated than income because high earners save a larger share of income, capital compounds faster than earned income grows, and inheritance perpetuates and amplifies wealth across generations.
The super-rich (top 0.1% and 0.01%):
Much of the rise in inequality since 1980 is concentrated at the very top, the top 0.1% rather than the top 10%. Piketty distinguishes:
The relative importance of "working rich" vs. "rentiers" has shifted over time. Before WWI, rentiers dominated. Mid-20th century, working rich were more important. The trend since 1980 suggests both are rising.
The "Super-Manager" Phenomenon
A specific U.S. pattern: the rise of extremely high compensation for corporate executives, particularly in the United States. Piketty documents that this is primarily a U.S. phenomenon. Similar countries have not seen the same extreme executive pay divergence.
His explanation: vague social norms about "market-based" executive compensation in the U.S. allowed self-reinforcing pay escalation through compensation committees. The marginal productivity theory (executives are paid their marginal contribution) cannot explain the pattern, since executive pay diverged dramatically from productivity in the 1980s without corresponding evidence of productivity divergence.
Critics' alternative: the executive pay rise reflects genuine scarcity of executive talent in a globalized economy where the returns to winning large businesses are enormous. This is genuinely contested.
Part IV: Regulating Capital
Piketty's most controversial section: his policy prescriptions.
The Progressive Wealth Tax
Piketty's main proposal: a global progressive annual tax on net wealth.
The proposed structure:
| Net Wealth | Proposed Annual Tax Rate |
|---|---|
| Below 1 million euros | 0% |
| 1-5 million euros | 1% |
| Above 5 million euros | 2% |
| Above 1 billion euros | Potentially 5-10% |
The rationale:
If capital earns 5% and a 2% wealth tax is imposed, the effective return is reduced to 3%. This is still above economic growth of 1-2%, but meaningfully reduced. The tax would slow but not reverse wealth concentration.
The feasibility problem:
A wealth tax requires knowing the value of all assets annually. For publicly traded securities, this is easy. For privately held businesses, real estate, art, and other illiquid assets, valuation is contested and expensive. Piketty acknowledges this and calls the global wealth tax "utopian" in the current environment, a North Star rather than an immediate policy prescription.
Wealth tax developments since the book:
Several countries have experimented with wealth taxes since Piketty's book was published. Spain introduced a temporary wealth tax in 2022-2023 on net assets above 3 million euros. Norway has had a wealth tax for decades, currently at 0.95% on net wealth above approximately $170,000. Colombia introduced a wealth tax in 2022. In the United States, Senator Elizabeth Warren's proposed wealth tax (2% above $50 million, 3% above $1 billion) has been debated but not enacted. The OECD has noted that wealth taxes have seen mixed results, with capital flight and valuation challenges being the primary obstacles. Read more about wealth taxes in our guide to tax brackets and progressive taxation.
What Else Could Work?
Piketty discusses alternatives:
Critical Assessment
What Piketty Got Right
The empirical contribution:
The historical dataset assembled in this book is an extraordinary scholarly achievement. Two centuries of wealth and income data for multiple countries, painstakingly collected and made freely available, has enabled subsequent researchers to extend and refine Piketty's analysis. The World Inequality Database (wid.world) continues to be updated and now covers over 200 countries.
The long-run tendency:
The r > g logic is mathematically sound under its assumptions. When capital earns more than the economy grows, capital's share of income rises. This is not controversial as an accounting identity.
The warning about 21st-century capitalism:
Piketty's core warning, that demographic slowdown and slowing productivity growth could return us to 19th-century levels of wealth concentration unless deliberate policy counteracts it, is a legitimate and important concern. The World Inequality Report 2024 confirmed that global wealth concentration has continued to increase, with the top 0.1% capturing 11% of global wealth growth since 1995.
Where Critics Have Pushed Back
The return on capital assumption:
Piketty assumes a stable 4-5% return on capital. Critics argue:
The mismeasurement critique:
A group of economists challenged Piketty's data, arguing that some of the wealth increases reflect rising housing prices (not productive capital) and that accounting for pensions and government wealth changes the picture materially.
The political economy response:
Democratic societies have historically responded to extreme inequality with redistribution. Progressive taxation was enacted in the early 20th century precisely in response to Gilded Age inequality. Piketty's scenario assumes this political response does not occur.
The generalizability problem:
The 2025 study in the Journal of Income Distribution found that Piketty's second fundamental law of capitalism does not generalize beyond the specific developed economies he studied. Different institutional structures, savings behaviors, and capital market development levels produce different relationships between growth, savings, and wealth concentration.
The Investment Implications
For investors, Piketty's analysis generates several important observations:
Capital Returns Have Been Robust Long-Run
The historical evidence Piketty assembles confirms what equity investors already know: long-run returns on diversified capital have been approximately 4-6% real annually across centuries and geographies. This supports the case for long-horizon equity investing. Read our guide to stock market returns for more on historical performance.
Housing Has Become a Larger Share of Wealth
One of Piketty's key findings: housing has become the dominant form of private wealth in most developed countries, displacing agricultural land and business capital as in the 19th century. For individual investors, this suggests:
The Return on Capital vs. Labor Divide
Piketty's data validates the long-run outperformance of capital investment over labor income. This supports a consistent message from all value investing and passive investing literature: invest early, invest broadly, and let capital compounding work on your behalf. Our guide to dollar-cost averaging shows how to put this into practice.
Strengths & Weaknesses
What We Loved
Areas for Improvement
Who Should Read This Book
Highly Recommended For
Probably Not For
Frequently Asked Questions
Q: Do I need to read all 696 pages?
A: No. The core thesis is in Part I-II (approximately 100 pages). The historical chapters are valuable for depth but not essential for the main argument. The policy section (Part IV) is worth reading for the policy debate but is the most contested portion.
Q: Does Piketty's thesis support investing in equities vs. bonds?
A: Yes, implicitly. His data shows that equities and real assets consistently earn r above inflation over the long run. Bonds typically earn less. The investor implication: own capital (equities, real estate) rather than lend capital (bonds) for long-horizon wealth accumulation.
Q: Has Piketty's prediction about rising wealth concentration been confirmed?
A: Yes. The World Inequality Report 2024 confirmed that global wealth concentration has continued to increase, with the top 10% holding approximately 76% of all wealth and the bottom 50% holding just 2%. The top 0.1% has captured 11% of global wealth growth since 1995. However, a 2025 study found that Piketty's second fundamental law does not generalize to all economies, so the mechanism may be more complex than the book suggests.
Final Verdict
Rating: 4.3/5
Capital in the Twenty-First Century is one of the most important economics books of the 21st century. Its empirical database, long historical perspective, and r > g framework are genuine contributions to understanding wealth dynamics. The World Inequality Report 2024 has confirmed its core predictions about rising wealth concentration, though 2025 research has shown that the second fundamental law does not generalize universally. Its length, its contested data, and its confident policy prescriptions prevent a higher rating. The core thesis is well worth understanding even if the full 696 pages are more than most readers need.
Want to understand how these macro forces affect your personal finances? Use our net worth calculator to see where you stand, and read our guide to building generational wealth for practical steps to make capital work for you.
Get Your Copy
Hardcover: Buy on Amazon
Kindle: Buy on Amazon
Prices current as of publication date. Free shipping available with Prime.