*Disclosure: This article contains affiliate links. If you purchase through these links, we may earn a commission at no additional cost to you. We only recommend books we have personally read and genuinely believe in.
Quick Overview
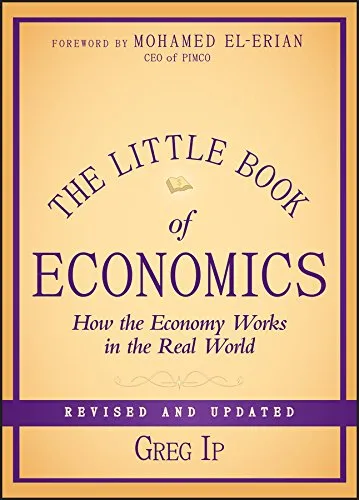
Greg Ip wrote the book I wish I had read before my first economics course. The Little Book of Economics explains how the economy works in 256 pages without a single graph or equation. It covers GDP, inflation, the business cycle, monetary policy, fiscal policy, trade, exchange rates, and financial crises. The 2013 revised edition added post-2008 crisis material, but the book predates the 2025 tariff shock, the Fed's three rate cuts in late 2025, and the six-week federal government shutdown that distorted Q4 economic data. Testing Ip's frameworks against 2025 events reveals which chapters have aged well and which need supplementing.
Book Details
| Attribute | Details |
|---|---|
| Title | The Little Book of Economics |
| Author | Greg Ip |
| Publisher | Wiley |
| First Published | 2010 (Revised 2013) |
| Pages | 256 |
| Reading Level | Beginner to Intermediate |
| Amazon Rating | 4.4/5 stars |
Get Your Copy
Paperback: Buy on Amazon
Kindle: Buy on Amazon
About the Author
Greg Ip is the chief economics commentator at The Wall Street Journal, where he writes the Capital Account column. He previously covered the Federal Reserve for The Economist and the WSJ. He holds a degree in economics and journalism from Carleton University. His second book, Foolproof (2015), explores how safety mechanisms can create dangerous complacency, a theme directly relevant to the 2025 tariff debate.
Ip is not an academic. He is a working journalist who talks to Fed officials, Treasury secretaries, and CEOs regularly. This gives the book a practitioner's edge: the explanations reflect how economic policy actually gets made, not just how textbooks describe it.
GDP: The Economy's Scorecard
Ip opens with GDP, the most comprehensive measure of economic activity. The formula is simple:
GDP = Consumption (C) + Investment (I) + Government Spending (G) + Net Exports (X - M)The U.S. breakdown is roughly 70% consumption, 15% business investment, 17% government spending, and -2% net exports. Consumer spending dominates, which is why employment and wage growth matter so much for the economic outlook.
The 2025 data tests this framework nicely. Real GDP grew 2.1% for the full year, down from 2.8% in 2024. But the quarterly path was erratic: Q3 surged at 4.4% annualized, then Q4 collapsed to 0.7%. The BEA's second estimate revealed that a six-week federal government shutdown subtracted an estimated 1.0 percentage point from Q4 growth. Government spending fell, exports declined, and consumer spending decelerated.
This is exactly the kind of GDP decomposition Ip teaches. The components tell you what is driving growth and what is dragging it down. An investor who understood the framework could look at the Q4 data and immediately identify the shutdown as a temporary distortion rather than a structural collapse.
What GDP misses: household production, environmental degradation, income distribution, and leisure. GDP can rise while average households feel financially stressed, a disconnect that drives political tension.
Inflation: The 2025 Stress Test
Ip explains inflation as too much money chasing too few goods. The Fed's target is 2% PCE inflation. The book covers the four types: demand-pull, cost-push, monetary, and expectations-driven.
The 2025 inflation data provides a case study in cost-push inflation. The U.S. raised average tariff duties from 2.4% to 9.6%, the highest level in eighty years. A Fed research note found that tariff pass-through to consumers was at least 30% for goods imported from China, with an 8.5% year-over-year price increase by December 2025. This is textbook cost-push inflation: an external supply shock raises prices regardless of demand conditions.
PCE inflation ran at 2.9% year-over-year in December 2025. Core PCE was 3.0%, its fastest pace since early 2025. The three-month annualized pace reached 3.1%. Chair Powell acknowledged the tariff effect: "Higher tariffs are pushing up prices in some categories of goods, resulting in higher overall inflation. A reasonable base case is that the effects on inflation will be relatively short-lived, a one-time shift in the price level. But it is also possible that the inflationary effects could instead be more persistent."
Ip's framework handles this well. The book explains why cost-push inflation is difficult for the Fed: raising rates to fight it risks recession, but not raising it risks embedding inflation expectations. The 2025 data shows the Fed chose to cut rates (supporting employment) while accepting inflation above target.
The Business Cycle
Ip provides one of the clearest explanations of business cycles available in any popular book. The four phases are expansion, peak, contraction, and trough. Post-WWII U.S. recessions have averaged about 10 months.
The book lists five causes of recessions: monetary tightening, demand shocks, financial crises, inventory corrections, and asset price collapses. The 2025 episode does not fit neatly into any single category. The Q4 slowdown combined a government shutdown (demand shock), tariff-driven price increases (cost-push), and monetary policy easing (the opposite of tightening). This is the kind of complex, multi-causal slowdown that Ip's framework can describe but not fully predict.
Monetary Policy: The Fed in 2025
Ip's chapter on monetary policy is the book's strongest section. He explains the dual mandate, the tools, and the transmission mechanism with unusual clarity.
The 2025 Fed cycle validates the framework perfectly. The Fed cut rates three times in the second half of the year:
| Date | Rate Decision | Target Range | Context |
|---|---|---|---|
| September 17, 2025 | -0.25% | 4.00-4.25% | Downside risks to employment rising |
| October 29, 2025 | -0.25% | 3.75-4.00% | Concluded balance sheet runoff |
| December 10, 2025 | -0.25% | 3.50-3.75% | Inflation still elevated, employment softening |
Source: Federal Reserve FOMC statements
The FOMC minutes reveal the internal debate: several participants noted that setting aside tariff effects, inflation was close to the 2% target. Others warned that overall inflation had been above target for some time. The Committee split three ways on the December decision: one member wanted a 50 basis point cut, two wanted no change, and the majority chose 25 basis points.
This is the monetary policy trade-off Ip explains in Chapter 8. The Fed cannot simultaneously maximize employment and minimize inflation when the two goals conflict. The 2025 cycle is a real-time demonstration.
Fiscal Policy and the 2025 Shutdown
Ip covers fiscal policy mechanics: how government spending and taxation affect the economy, and the political constraints on their use. The fiscal multiplier is larger when there is unused capacity and smaller when the economy is near full employment.
The 2025 government shutdown provides a case study in fiscal policy disruption. The BEA estimated that the reduction in federal services subtracted about 1.0 percentage point from Q4 GDP growth. Furloughed federal employees received back pay, so the shutdown had no impact on current-dollar federal compensation, but the reduction in services provided was real. BLS could not collect October CPI data, forcing the BEA to impute inflation figures.
Ip's framework predicts this: government shutdowns reduce economic activity in the short term, but the effects reverse after the shutdown ends. The Q4 GDP distortion was temporary, not structural.
Trade and Exchange Rates
Ip explains comparative advantage and exchange rate determination. The 2025 tariff episode is the most significant trade policy shift since the book was written.
An NBER working paper estimates that the 2025 tariffs raised average duties from 2.4% to 9.6%, bringing protectionism to its highest level in eighty years. The net welfare impact was between -0.13% and +0.10% of GDP. The trade deficit did not shrink; it actually expanded for the year as exports slowed more rapidly than imports.
Ip's trade framework correctly predicts the aggregate outcome: tariffs impose net costs on the economy. What the book does not anticipate is the political economy. The 2025 tariffs were popular with significant portions of the electorate despite their economic costs, because the distributional effects (protecting specific industries) felt more salient than the aggregate effects (higher consumer prices).
Financial Crises: The Minsky Model
Ip applies the Minsky model to explain financial crises: stable conditions lead to rising risk appetite, easy credit fuels asset prices, borrowing against rising assets creates a self-reinforcing cycle, until a confidence collapse triggers deleveraging.
The book adds three key insights: the Fed as lender of last resort can arrest panic if it acts quickly, contagion spreads crisis from financial sector to real economy through credit contraction, and policy errors can turn a financial crisis into a depression.
The 2023 SVB collapse, which postdates the book, fits the Minsky model perfectly. Low interest rates encouraged duration risk-taking, rising rates exposed the vulnerability, and a confidence collapse triggered a deposit run. The Fed's emergency lending facility acted as lender of last resort, confirming Ip's framework.
Economic Indicators for Investors
Ip provides a practical guide to the data releases that move markets:
| Indicator | Released | What It Shows | Market Impact |
|---|---|---|---|
| Non-Farm Payrolls | First Friday of month | Monthly job creation | Very High |
| CPI/PCE | Monthly | Inflation | Very High |
| GDP | Quarterly | Overall economic growth | High |
| ISM Manufacturing | First business day | Factory activity | High |
| Consumer Confidence | Monthly | Consumer sentiment | Medium |
| Retail Sales | Monthly | Consumer spending | Medium-High |
| Housing Starts | Monthly | Real estate activity | Medium |
| Jobless Claims | Weekly | Labor market | Medium |
Ip recommends against trading economic releases. The market prices in expectations before release, and surprise moves are genuinely random. Instead, use economic data to assess the business cycle stage, inform long-term asset allocation, and understand the context for individual company results.
Strengths & Weaknesses
What We Loved
Areas for Improvement
Who Should Read This Book
Highly Recommended For
Probably Not For
Comparison to Similar Books
| Book | Focus | Approach | Best For |
|---|---|---|---|
| The Little Book of Economics | Macro for investors | Journalist's perspective, clear | Investors wanting market context |
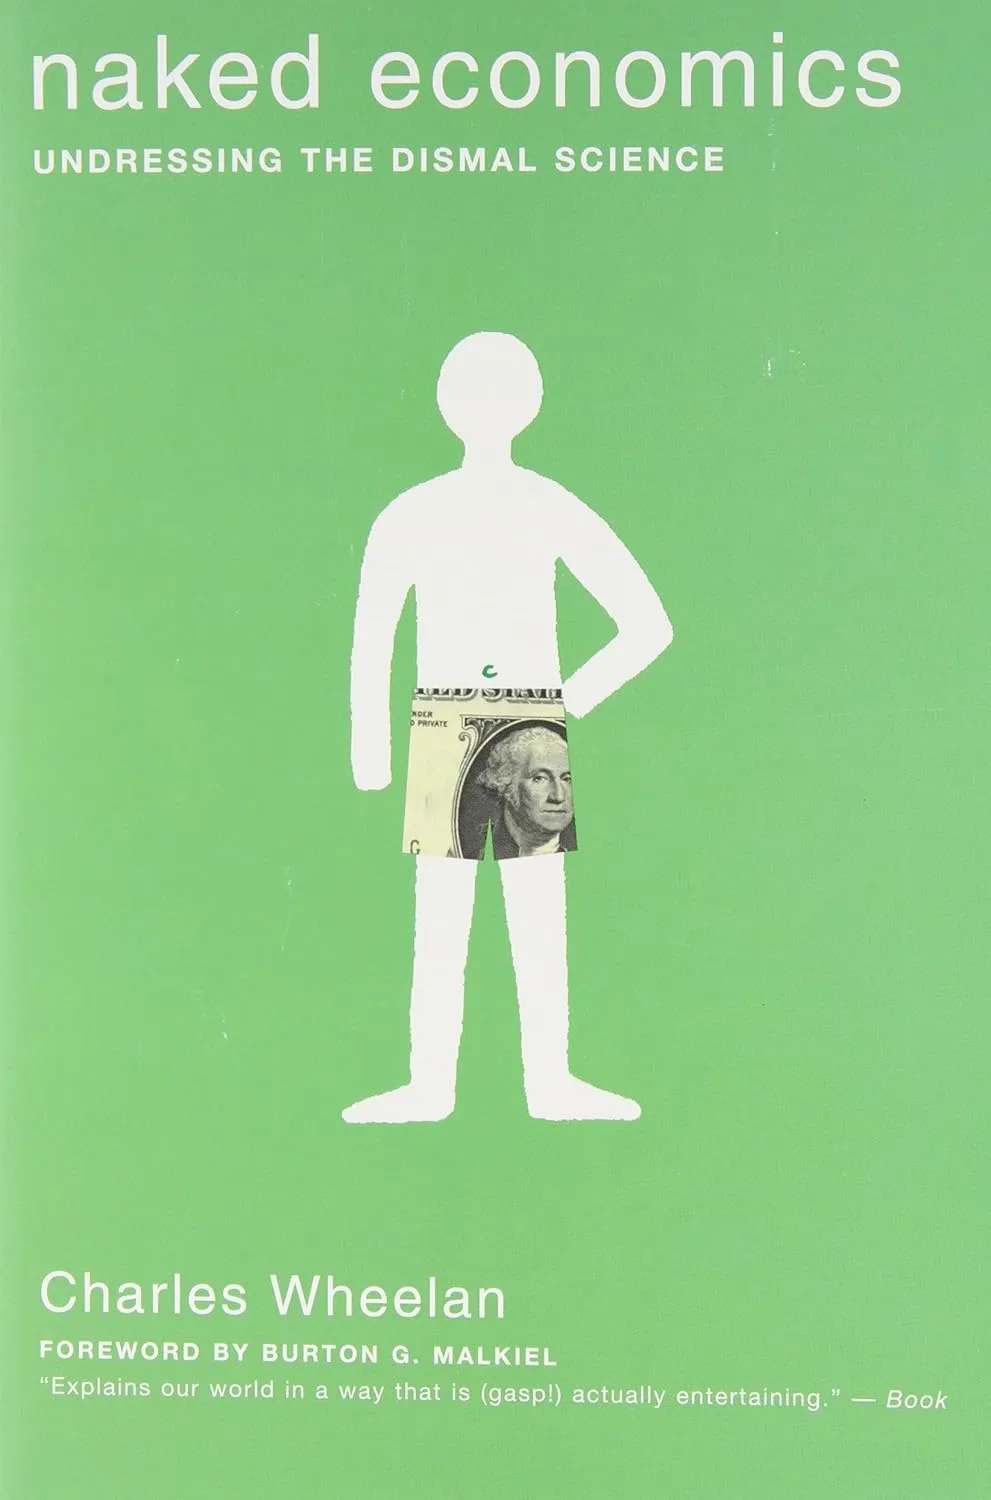
| Naked Economics (Wheelan) | Full economics overview | Plain English, examples | Beginners wanting the whole picture |
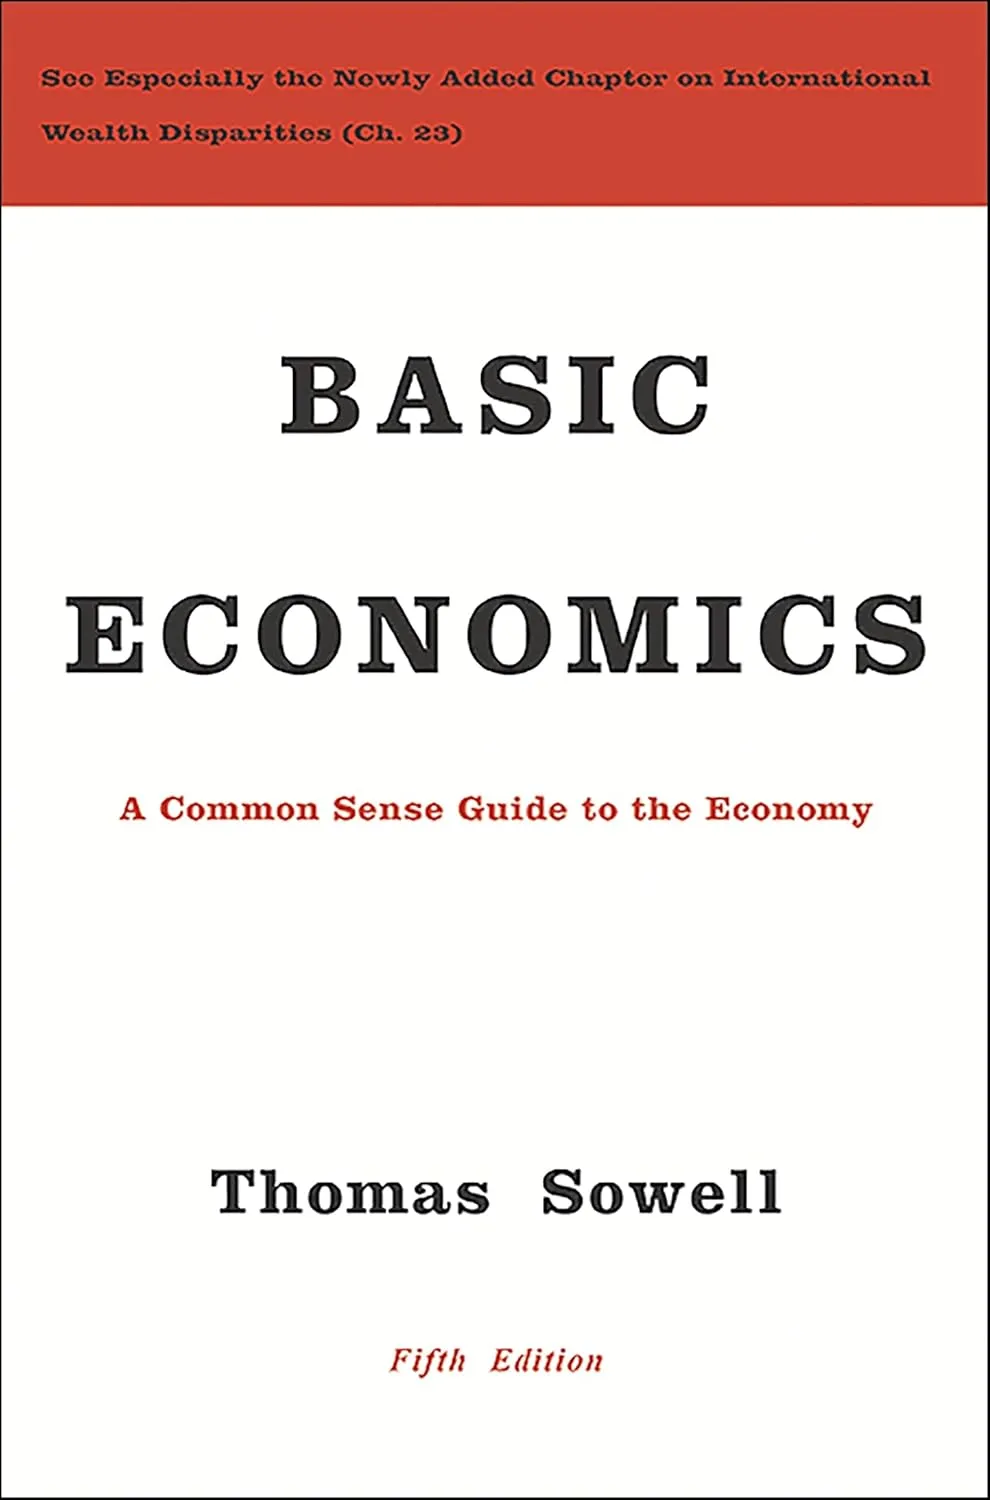
| Basic Economics (Sowell) | Full economics overview | More detailed, systematic | Readers wanting more depth |
| Manias, Panics, and Crashes (Kindleberger) | Financial crises | Historical, analytical | Understanding crisis patterns |
Read The Little Book of Economics for the investor's macro perspective. Read Naked Economics for a broader introduction. Read Basic Economics for more systematic depth.
Implementation Guide
Using Economics to Make Better Investment Decisions
Step 1: Track the business cycle
Step 2: Understand the Fed's posture
Step 3: Watch fiscal policy
Step 4: Monitor trade policy
Step 5: Read the indicators, do not trade them
Frequently Asked Questions
Q: Is this book or Naked Economics better for beginners?
A: The Little Book of Economics is better for investors who want to understand the macro forces affecting their portfolio. Naked Economics is better for a broader introduction to economic thinking. They overlap significantly but have different emphases.
Q: Does the book cover the 2025 tariff shock?
A: No. The 2013 revised edition predates the 2025 tariffs. The book's trade framework (comparative advantage, distributional effects) is correct and useful, but readers need current sources for the 2025 specifics.
Q: How does the monetary policy chapter hold up against 2025 Fed actions?
A: Very well. The Fed's 2025 dilemma (cutting rates while inflation remained above target) is exactly the trade-off Ip describes. The three rate cuts in September, October, and December 2025 are a real-time validation of the framework.
Q: Should I read this before or after learning about value investing?
A: Before. Understanding the macro environment helps you contextualize why value stocks outperformed in 2025 (rising rates and tariff-driven inflation favored shorter-duration assets). Read this for context, then read The Little Book of Value Investing for strategy.
Final Verdict
Rating: 4.3/5
The Little Book of Economics remains the best accessible macroeconomics primer for investors. Its business cycle framework, monetary policy explanation, and economic indicator guide provide genuine value. The 2025 Fed cycle, tariff shock, and GDP data validate the book's core frameworks while revealing areas that need supplementing (trade political economy, AI and labor markets, digital currencies). Read it for the foundation. Update with current sources for what Ip could not have anticipated.
Get Your Copy
Paperback: Buy on Amazon
Kindle: Buy on Amazon
Prices current as of publication date. Free shipping available with Prime.