*Disclosure: This article contains affiliate links. If you purchase through these links, we may earn a commission at no additional cost to you. We only recommend books we genuinely believe in.
Quick Overview
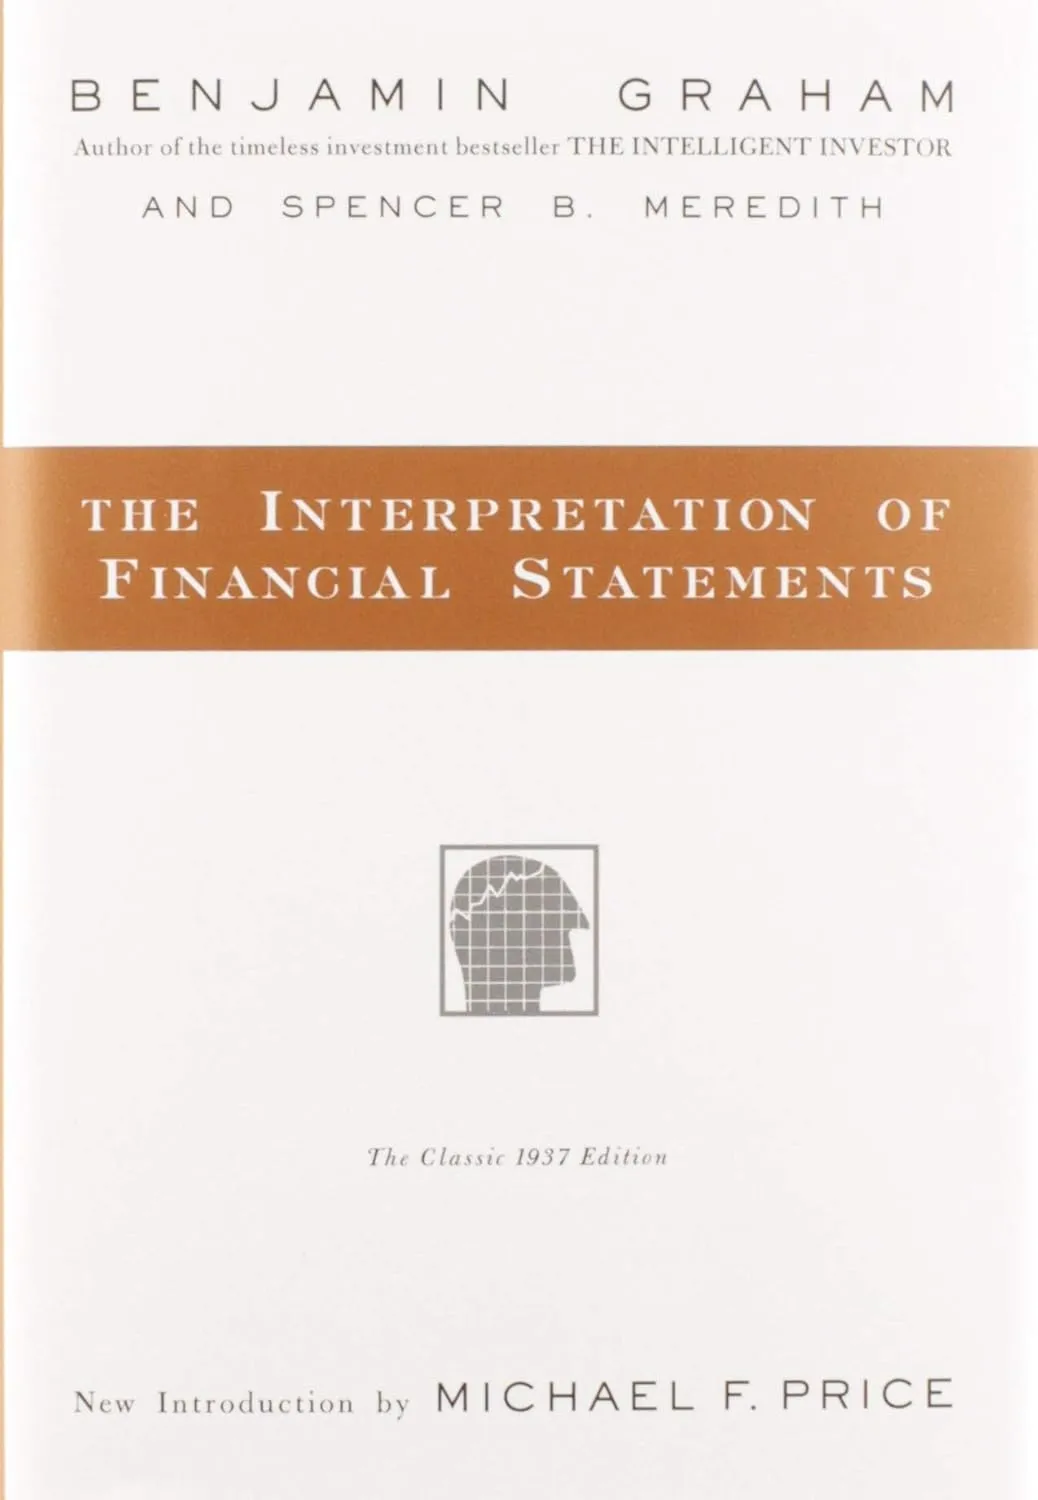
Most investors today treat financial statements like nutrition labels: they glance at the headline number and move on. Benjamin Graham thought that was lazy and dangerous. In 1937, three years after publishing Security Analysis, he wrote this 160-page companion volume to teach ordinary investors how to actually read a balance sheet and income statement before risking a single dollar.
The book has stayed in print for nearly 90 years because the analytical framework Graham laid out, rooted in earnings power, asset values, and dividend-paying ability, still catches what earnings manipulation hides. In 2025, a Pro Invest News analysis revisited Graham's key ratios and concluded that his working capital and current ratio tests remain surprisingly effective at flagging companies headed for trouble. When I first read this book in 2019, I was working through my first individual stock analysis. I had read The Intelligent Investor cover to cover but still could not tell you whether a company's current ratio of 1.2 was safe or alarming. This book filled that gap in an afternoon.
Book Details
| Attribute | Details |
|---|---|
| Title | The Interpretation of Financial Statements |
| Authors | Benjamin Graham & Spencer Meredith |
| Publisher | Harper Business |
| First Published | 1937; Updated edition 1998 |
| Pages | 160 |
| Reading Level | Beginner to Intermediate |
| Amazon Rating | 4.5/5 stars |
Get Your Copy
Paperback: Buy on Amazon
Kindle: Buy on Amazon
About the Author
Benjamin Graham (1894-1976) is the father of value investing and security analysis. He taught at Columbia Business School for over 28 years and mentored Warren Buffett, Irving Kahn, Walter Schloss, and other legendary investors. His books Security Analysis (1934, with David Dodd) and The Intelligent Investor (1949) are the foundational texts of fundamental investing. Spencer B. Meredith was an instructor in security analysis at the New York Stock Exchange Institute, and this shorter book was co-written as a more accessible introduction to financial statement analysis.
Graham's Analytical Framework
Graham's fundamental premise: the stock market is a mechanism for transferring wealth from the impatient to the patient. To invest rather than speculate, you must analyze the actual business behind the stock, and that requires reading financial statements.
The Three Documents
Graham requires mastery of three documents before any investment decision:
1. The Income Account (Income Statement)
Graham called the income statement "the most important of the three financial statements from the investment standpoint." It answers: Is this business profitable, and how reliably? Graham focused on:
2. The Balance Sheet
The balance sheet answers: What does the company own and owe? Graham's balance sheet analysis focused on:
3. The Surplus Account (Statement of Retained Earnings)
The surplus account connects the income statement and balance sheet, showing how earnings were deployed: paid as dividends or retained to build the balance sheet.
The Key Ratios Graham Used
Earnings Analysis
Earnings per share (EPS):
EPS = Net Income Available to Common / Shares OutstandingGraham insisted on analyzing EPS over a full business cycle, typically 7-10 years, not just the most recent year. A single year's earnings can be distorted by:
The multi-year average:
Graham's practice: calculate the average earnings over the past 7-10 years as "normal earning power." Use this, not the most recent year, for valuation purposes.
Why single-year EPS misleads:
| Year | EPS | What Was Happening |
|---|---|---|
| 1 | $3.00 | Normal business |
| 2 | $4.20 | Boom; above-normal demand |
| 3 | $5.50 | Peak; capacity constraints; high margins |
| 4 | $2.80 | Recession begins |
| 5 | $1.20 | Deep recession; normalized margins |
| 6 | $2.60 | Recovery |
| 7-year average | $2.76 | True normal earning power |
Buying at the peak year ($5.50 EPS × 15 P/E = $82.50) and valuing on the trough year ($1.20 EPS) produces dramatically different conclusions. The 7-year average ($2.76) provides a more stable foundation.
The price-earnings ratio:
P/E = Stock Price / Earnings per ShareGraham's guidance on P/E:
These levels are relative to the interest rate environment. When rates are very low, higher P/E ratios are appropriate. The modern Shiller CAPE (cyclically adjusted P/E) extends Graham's multi-year average concept.
Balance Sheet Analysis
The Current Ratio:
Current Ratio = Current Assets / Current LiabilitiesGraham's standard: current ratio above 2.0 for industrial companies, 1.5 for utilities.
A current ratio below 1.0 means the company cannot pay its near-term obligations with its liquid assets, a warning sign of potential financial distress.
Net Working Capital (NWC):
NWC = Current Assets - Current LiabilitiesNWC measures the buffer of liquid assets available after short-term obligations. Graham particularly liked companies where NWC exceeded total debt, meaning the company could theoretically pay off all its debt with liquid assets alone.
The Net Current Asset Value (NCAV):
Graham's most famous screen:
NCAV = Current Assets - Total Liabilities (all liabilities, not just current)When a company's stock price falls below NCAV, you are effectively paying less than the liquidation value of just the current assets, getting the long-term assets for free.
Graham found that portfolios of stocks at 2/3 of NCAV or less produced approximately 15% annual returns versus 11% for the market over the periods he studied.
Debt ratios:
Long-term Debt to Equity = Long-term Debt / Shareholders' Equity

Interest Coverage = Earnings Before Interest & Taxes / Interest Expense
Graham's guidelines:
Dividend Analysis
Dividend yield:
Dividend Yield = Annual Dividend / Stock PriceGraham valued dividend-paying ability highly. A company that consistently pays dividends demonstrates:
Payout ratio:
Payout Ratio = Dividends Paid / Net EarningsGraham's guidance:
A very high payout ratio is a warning sign. The dividend may be cut, and the company is not investing in future earnings growth.
Graham's Warning Signs
Graham identifies specific patterns that warrant heightened scrutiny:
Income Statement Warning Signs
| Warning Sign | What to Look For |
|---|---|
| Non-recurring income | Gains from asset sales, insurance recoveries, or lawsuit settlements inflating earnings |
| Inventory write-up income | Accounting changes that boost reported profits |
| Depreciation rate changes | Extending asset lives reduces depreciation expense, inflating earnings |
| Revenue recognition questions | Long-term contract accounting that front-loads revenue |
| Earnings below cash flow | Accruals building without cash confirmation |
The EBIT vs. cash earnings test:
Cash Earnings = Net Income + Depreciation & Amortization

If Cash Earnings << Net Income: accounting choices may be inflating reported profits
If Cash Earnings >> Net Income: accounting may be conservative; true earnings higher
Balance Sheet Warning Signs
| Warning Sign | What to Look For |
|---|---|
| Intangibles as large % of assets | Goodwill from acquisitions often overstated |
| Receivables growing faster than sales | Potential collection problems or channel stuffing |
| Inventory growing faster than sales | Demand weakness or obsolescence risk |
| Goodwill impairment charges | Confirms acquisitions overpaid |
| Off-balance-sheet obligations | Operating leases, pension underfunding |
The book value quality test:
Graham distinguished between "tangible book value" (book value minus intangible assets and goodwill) and total book value. Tangible book value represents assets that would have real liquidation value if the business were wound up. Goodwill and brand values depend entirely on the business's continued operation.
Tangible Book Value = Total Equity - Goodwill - Intangible Assets
Tangible Book Value Per Share = Tangible Book Value / Shares Outstanding
Stocks trading below tangible book value per share are Graham's most attractive candidates. They are valued below the physical replacement cost of their assets.
The Graham Screening Criteria (Consolidated)
For individual investors applying Graham's framework today:
The Defensive Investor Screen
| Criterion | Threshold |
|---|---|
| Adequate size | Revenue above $500M |
| Strong current ratio | Above 2.0x |
| Positive earnings | Every year for past 10 years |
| Uninterrupted dividends | Paid continuously for 20 years |
| Earnings growth | At least 1/3 increase in EPS over past 10 years |
| Moderate P/E | Below 15x average of last 3 years' EPS |
| Moderate price-to-book | Below 1.5x (or P/E × P/B below 22.5) |
The Enterprising Investor Screen
| Criterion | Threshold |
|---|---|
| Current ratio | Above 1.5x |
| Debt ratio | Below 110% of net current assets |
| Positive earnings | Past year and on 5-year average |
| Dividend history | Currently paying some dividend |
| Price-to-book | Below 1.2x |
| P/E | Below 9x average of last 3 years |
The Net-Net Screen
| Criterion | Threshold |
|---|---|
| NCAV/share | Price below 2/3 of NCAV per share |
| Current ratio | Above 1.5x |
| Long-term debt | Below NWC |
| Positive working capital trend | Not declining |
Adapting Graham for Modern Markets
Graham wrote for a different era: limited information, no computers, inefficient markets. Several adaptations are needed for 2026 investors:
What remains fully applicable:
What needs updating:
The Buffett evolution:
Warren Buffett explicitly moved beyond Graham's pure quantitative approach to focus on business quality:
Both approaches work, but Buffett's is more appropriate for modern markets where true Graham net-nets are rare. As Buffett noted at the 2025 Berkshire Hathaway annual meeting, the principles Graham taught about reading financial statements still form the foundation of every analysis Berkshire does, even if the specific screens have evolved.
Comparing Graham's Accounting Primer to Modern Alternatives
| Book | Era | Focus | Depth |
|---|---|---|---|
| Graham's Interpretation | 1937 (updated 1998) | Investment-focused analysis | Medium; very practical |
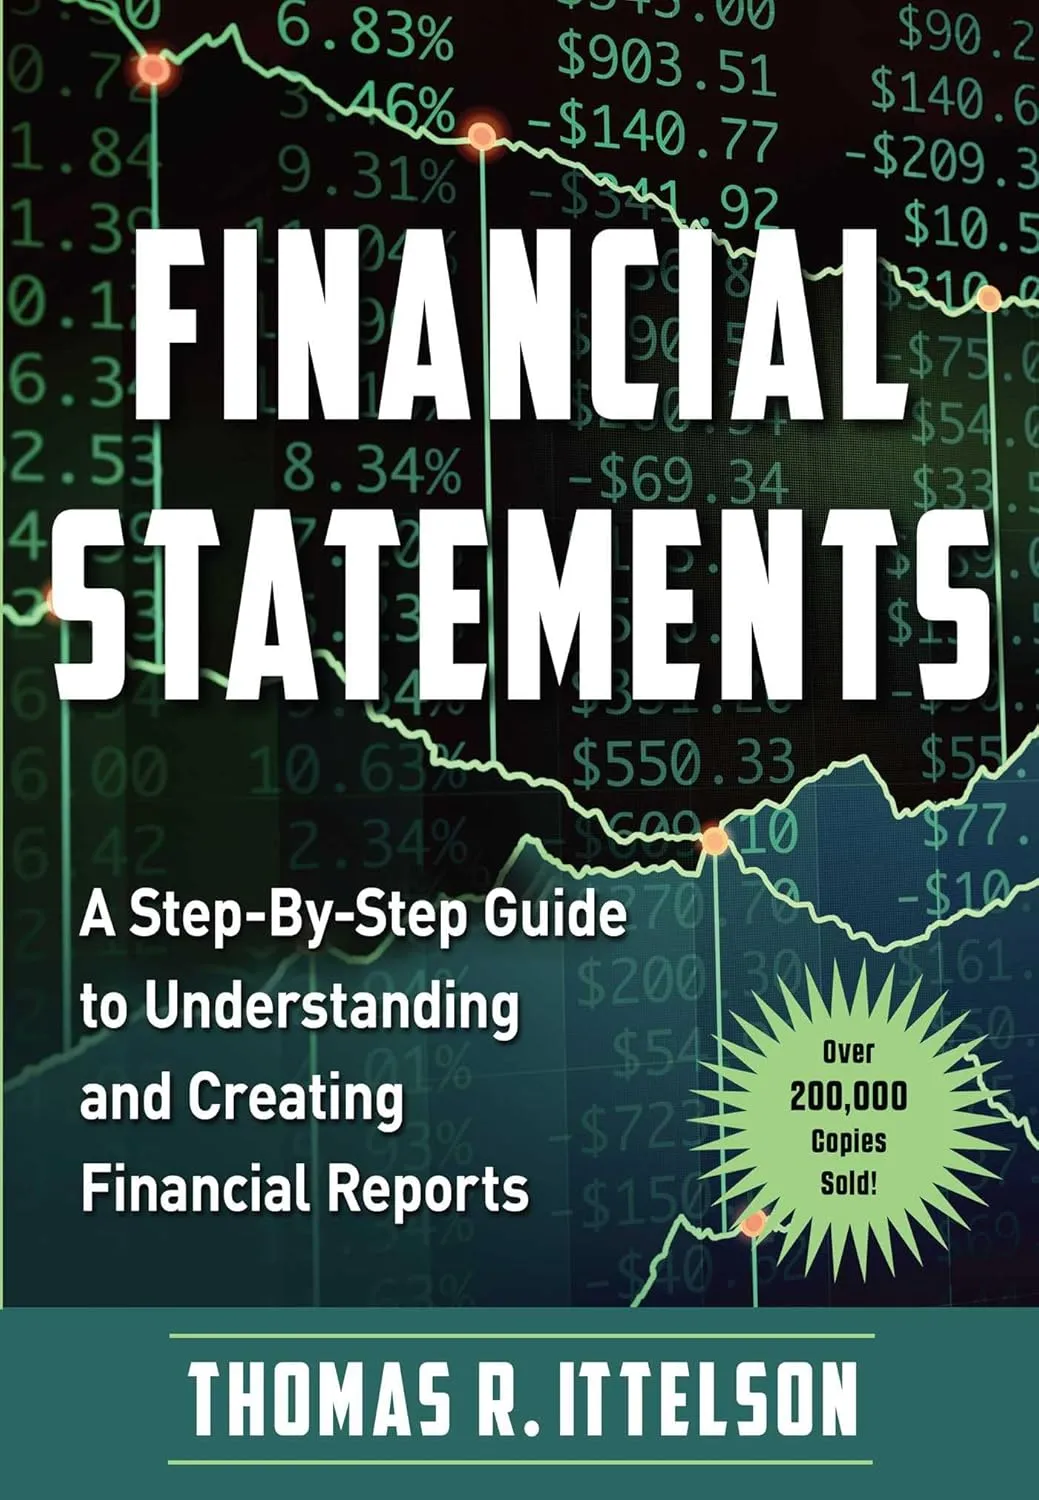
| Ittelson's Financial Statements | 1998 | Understanding mechanics | Medium; visual and accessible |
| Financial Shenanigans (Schilit) | 2018 | Detecting manipulation | Deep; forensic focus |
| Damodaran's Little Book of Valuation | 2011 | Valuation framework | Deep; DCF-focused |
Graham's book is the most investment-focused of the four. Ittelson is better for understanding mechanics from scratch. Schilit is better for fraud detection. Damodaran is better for valuation methodology. For a beginner who wants to understand what the numbers mean for an investment decision, Graham remains the best starting point.
Strengths & Weaknesses
What We Loved
Areas for Improvement
Who Should Read This Book
Highly Recommended For
Probably Not For
Frequently Asked Questions
Q: Should I read this before or after Security Analysis?
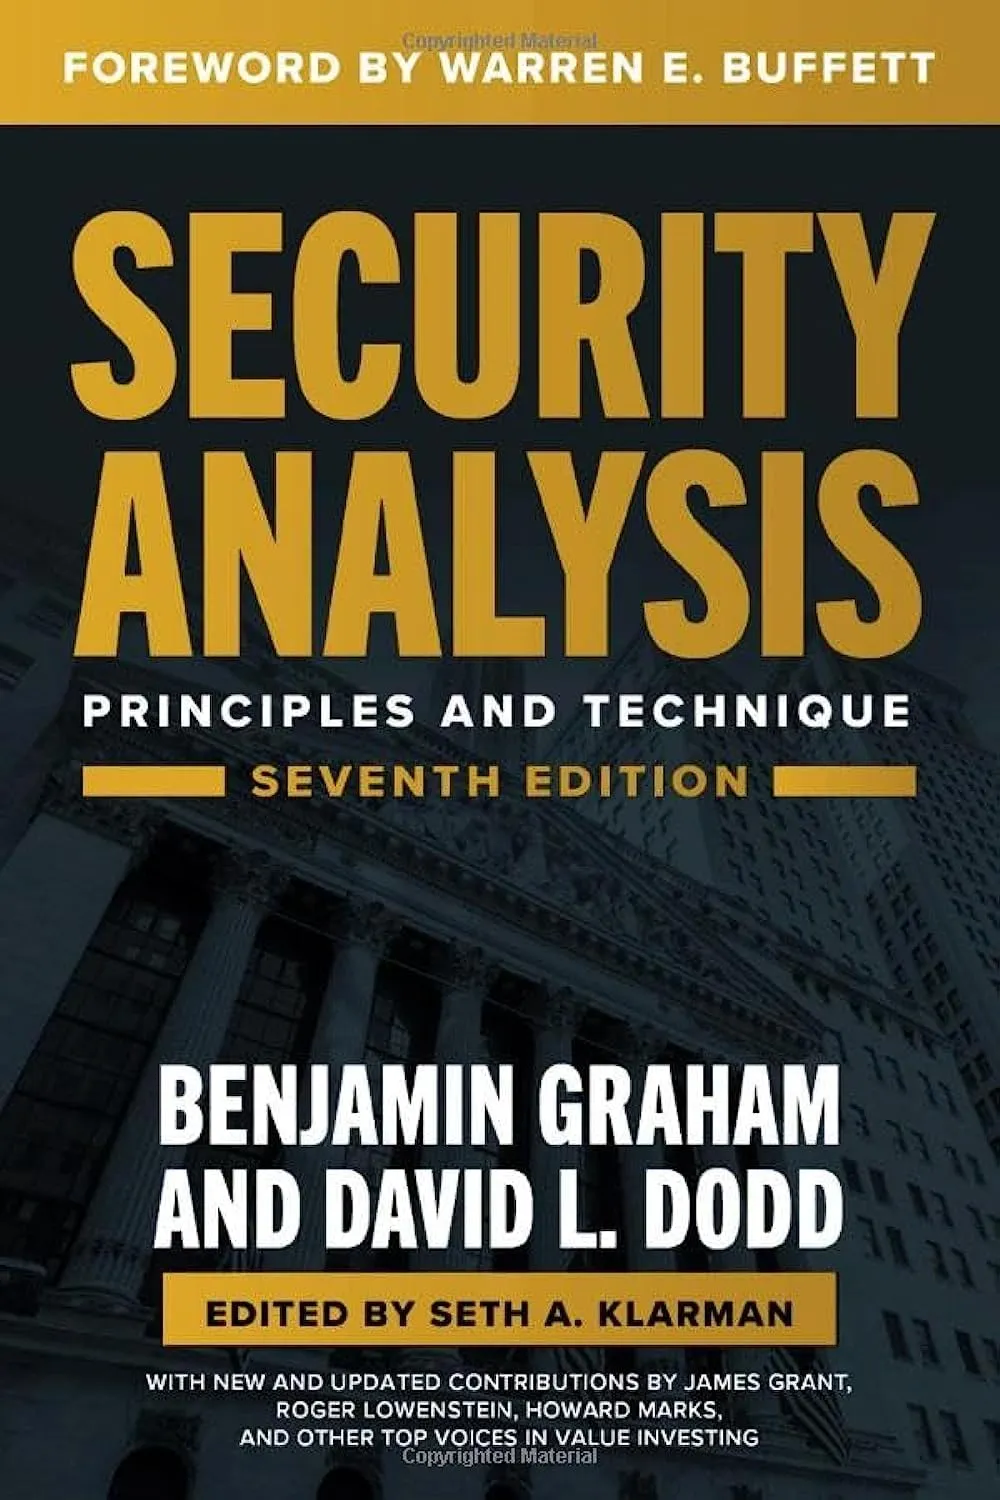
A: This book first. It is accessible and covers the essentials. Security Analysis is an encyclopedic reference that assumes you already understand the basics this book teaches.
Q: Is a 1937 book still useful for today's markets?
A: The analytical principles (earnings normalization, balance sheet strength, warning signs) are timeless. The specific thresholds and the net-net screen require updating for modern markets and accounting standards. The book's value is in the framework, not the specific numbers. A 2025 study by Pro Invest News confirmed that Graham's working capital tests still flag troubled companies effectively.
Q: Can I use Graham's screening criteria with modern stock screeners?
A: Yes. Most online screeners (Finviz, Morningstar, Stock Rover) let you filter by P/E ratio, current ratio, debt-to-equity, and dividend history. You can replicate Graham's Defensive Investor screen in about 10 minutes. The challenge is that very few U.S. stocks pass all criteria simultaneously in 2026's elevated market, which tells you something about current valuations.
Final Verdict
Rating: 4.5/5
The Interpretation of Financial Statements is the original financial statement analysis guide for investors, written by the discipline's founder. Its multi-year earnings normalization, balance sheet quality analysis, and warning sign checklist are foundational and directly applicable today. At 160 pages it is the most efficient path to Graham's analytical framework. The book shows its age in areas like cash flow analysis and intangible asset treatment, but the core principles remain the bedrock of fundamental investing nearly 90 years later.
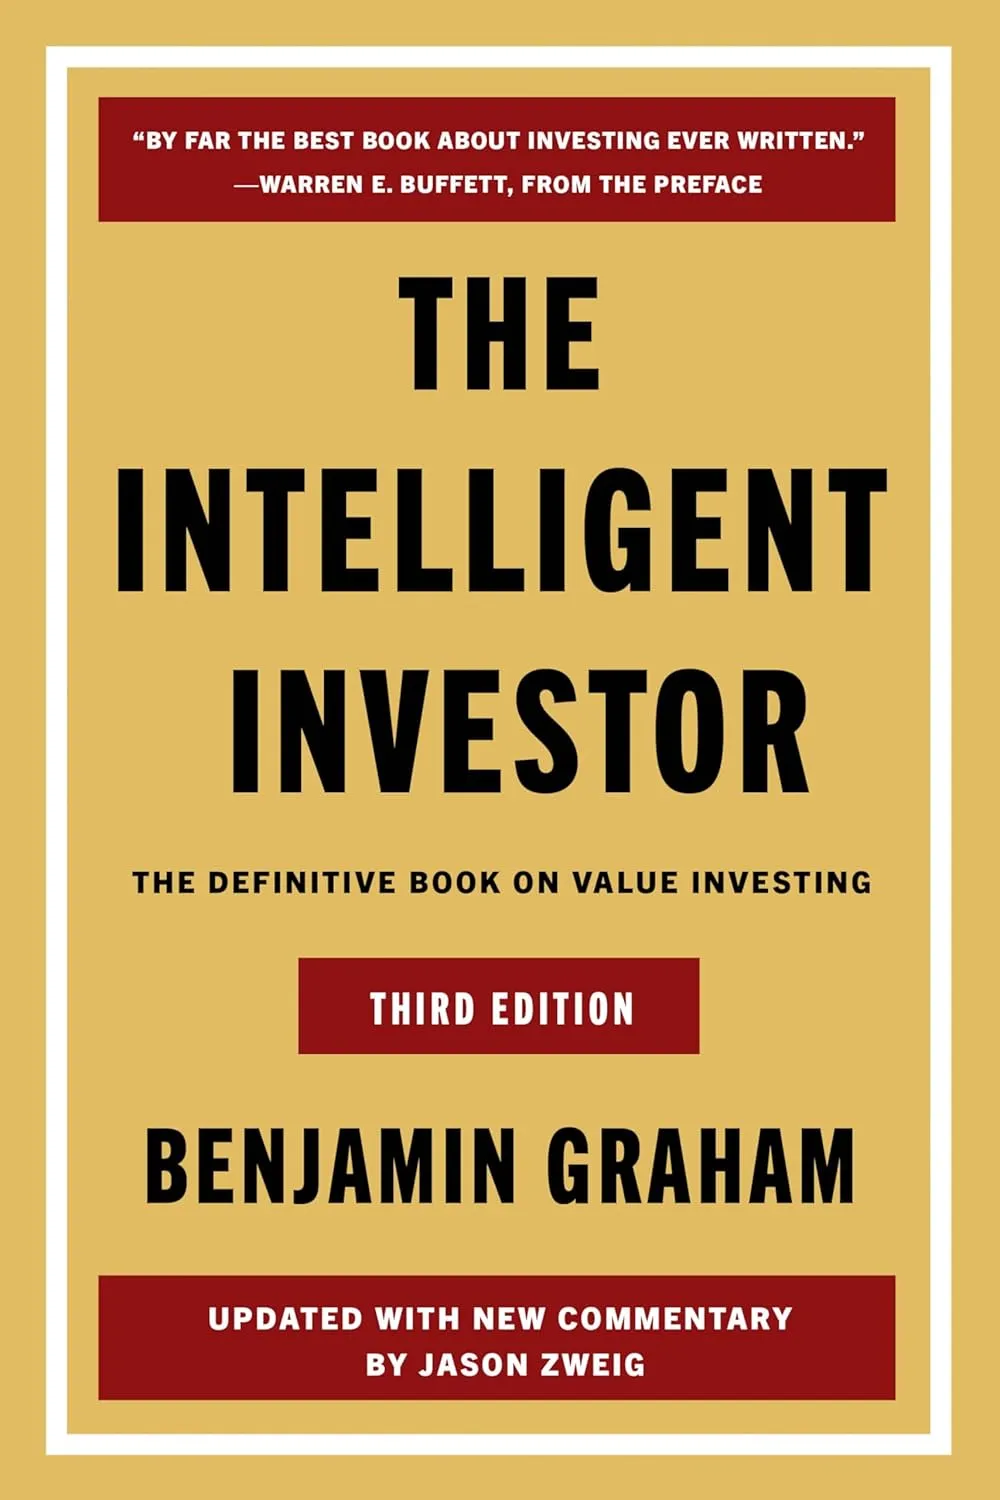
If you are serious about analyzing individual stocks, this book belongs on your shelf alongside The Intelligent Investor. For a deeper dive into how Graham's ideas apply to modern accounting fraud, pair it with Howard Schilit's Financial Shenanigans.
Get Your Copy
Paperback: Buy on Amazon
Kindle: Buy on Amazon
Prices current as of publication date. Free shipping available with Prime.