CDO (Collateralized Debt Obligation)
Quick Definition
A Collateralized Debt Obligation (CDO) is a structured finance product that pools various debt instruments (corporate loans, mortgages, bonds) and repackages them into securities with different risk and return levels called tranches. Investors in senior tranches get paid first but receive lower interest. Investors in equity tranches get paid last but receive higher interest to compensate for the added risk.
What It Means
A CDO works like a waterfall. Money flows from the underlying loans at the top, cascading down through layers of investors. The highest-rated tranches (AAA) catch the water first. The lowest-rated tranches (equity) get whatever is left. If the underlying loans default, the bottom tranches absorb the losses first, protecting the senior tranches up to a point.
The concept sounds simple, but the execution became one of the most destructive forces in financial history. Between 2003 and 2007, banks created CDOs backed by MBS containing subprime mortgages with deteriorating underwriting standards. Rating agencies stamped them AAA. When the housing market turned in 2007-2008, the cascade of defaults wiped out tranches that had been deemed safe, triggering the global financial crisis.
How It Works
CDO Structure
| Tranche | Typical Rating | Payment Priority | Risk | Return |
|---|---|---|---|---|
| Senior | AAA | Paid first | Lowest | Lowest |
| Mezzanine | BBB to AA | Paid after senior | Medium | Medium |
| Equity | Unrated | Paid last | Highest | Highest |
Example: A $500 million CDO
| Tranche | Size | Rating | Coupon |
|---|---|---|---|
| Senior | $400M (80%) | AAA | 5.00% |
| Mezzanine | $70M (14%) | BBB | 8.00% |
| Equity | $30M (6%) | Unrated | 15.00%+ |
The CDO buys $500M in loans paying an average of 7%. It pays 5% to senior, 8% to mezzanine, and whatever remains to equity. If all loans perform, equity earns a high return. If 6% of loans default, the equity tranche is wiped out entirely. If 20% default, mezzanine takes losses too.
Types of CDOs
| Type | Underlying Assets | Status |
|---|---|---|
| CLO (Collateralized Loan Obligation) | Corporate leveraged loans | Active and growing ($1.5T market) |
| CBO (Collateralized Bond Obligation) | Corporate bonds | Largely extinct |
| CDO squared | Other CDO tranches | Extinct |
| Synthetic CDO | Credit default swaps referencing debt | Largely extinct |
| ABS CDO | Asset-backed securities (including MBS) | Extinct after 2008 |
The 2008 Financial Crisis: CDOs' Role
What Went Wrong
- Deteriorating underwriting: Between 2003 and 2007, lenders originated millions of mortgages with little or no documentation, no down payment, and teaser rates that would reset higher
- Securitization machine: Banks packaged these mortgages into MBS and then into CDOs, creating demand for more loans regardless of quality
- Rating agency failures: AAA ratings were assigned to tranches backed by subprime loans based on models that assumed housing prices would never fall nationally
- CDOs of CDOs: Banks created "CDO squared" products that held tranches of other CDOs, amplifying losses when defaults occurred
- CDS amplification: Credit default swaps allowed investors to bet against CDOs without owning them, creating massive synthetic exposure
The Collapse
| Period | Event |
|---|---|
| 2006 | Subprime default rates began rising as teaser rates reset |
| 2007 | Bear Stearns hedge fund holdings with CDO exposure collapsed |
| March 2008 | Bear Stearns acquired by JPMorgan (forced sale) |
| September 2008 | Lehman Brothers filed for bankruptcy |
| 2008-2009 | Global financial crisis; approximately $2 trillion in CDO losses |
Banks and institutional investors worldwide held AAA-rated CDO tranches that turned out to be worth pennies on the dollar. The rating agencies' models had failed to account for a nationwide housing decline, which had never occurred in modern US history until it did.
The "Big Short"
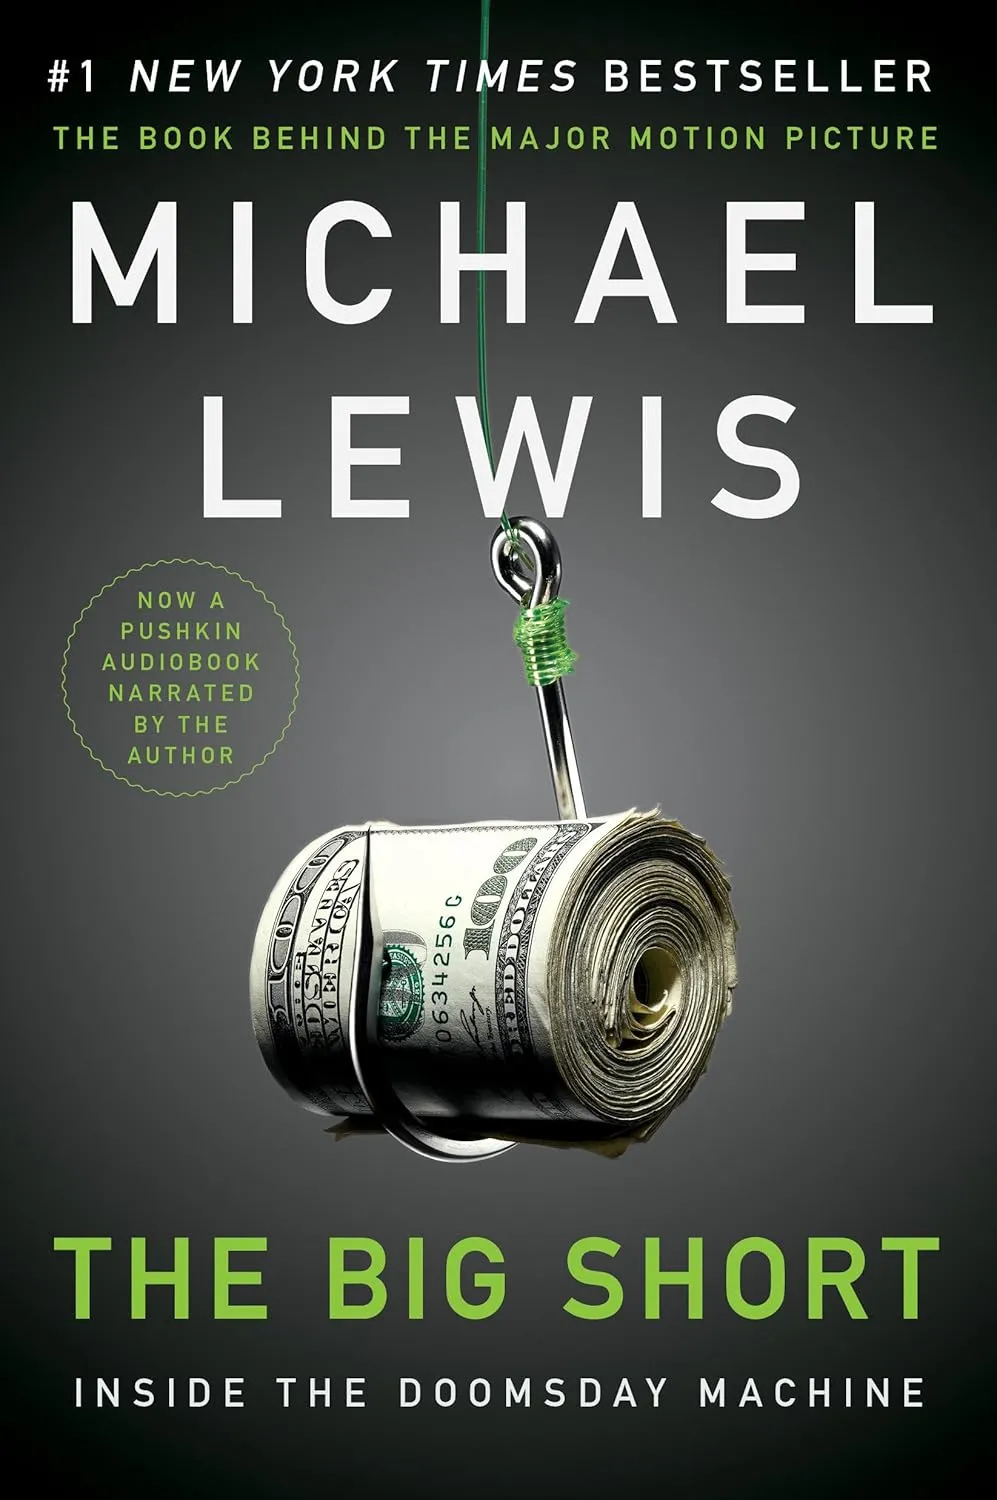
Some investors recognized the bubble and bought credit default swaps (CDS) to bet against CDOs. When the housing market collapsed, these CDS contracts paid out enormously. The story was popularized in Michael Lewis's book "The Big Short" and the 2015 film adaptation. Key figures included Michael Burry (Scion Capital), John Paulson (Paulson and Co.), and a small number of hedge fund managers who saw what the rating agencies missed.
| Investor | Strategy | Profit |
|---|---|---|
| Michael Burry (Scion Capital) | Bought CDS on specific MBS tranches | ~$2.69B total for fund |
| Steve Eisman (FrontPoint Partners) | Shorted CDO tranches via CDS | ~$1B+ |
| Cornwall Capital (Ledley, Mai) | Cheap CDS on CDO tranches | ~$80M on $30M investment |
| Deutsche Bank (Greg Lippmann) | Sold CDS to these buyers | Facilitated the trade; conflicted position |
CLOs: The Surviving Form of CDO
While mortgage-backed CDOs disappeared after 2008, Collateralized Loan Obligations (CLOs) survived and thrived. CLOs pool leveraged corporate loans (non-investment-grade loans to companies) rather than mortgages.
Why CLOs Survived
| Factor | Explanation |
|---|---|
| Better collateral | Corporate loans have stronger underwriting than subprime mortgages |
| Diversification | A typical CLO holds 200-300 loans across industries, reducing concentration risk |
| Floating rate | Most leveraged loans have floating interest rates, reducing rate risk |
| Active management | CLO managers can trade loans within the portfolio, unlike static CDO structures |
| Regulatory safeguards | Post-crisis regulations (Dodd-Frank, Volcker Rule) imposed risk retention and transparency requirements |
CLO Market Size and Activity (2025-2026)
| Metric | Value |
|---|---|
| Total global CLO market (collateral AUM, Dec 2025) | $1.53 trillion |
| US BSL CLO market | $993 billion |
| US middle-market CLO market | $200 billion |
| European CLO market | $339 billion equivalent |
| US BSL CLO issuance (2025) | $472 billion across 1,045 deals |
| US private credit CLO issuance (2025) | $84.73 billion across 145 deals |
| BofA projected 2026 issuance | $600 billion (record) |
2026 CLO Market Dynamics
BofA Securities projects a record $600 billion in CLO issuance for 2026, comprising $195 billion in new issuance ($155 billion BSL plus $40 billion private credit), $275 billion in resets, and $130 billion in refinancings. The first half of 2026 focused on refinancings and resets, with new issuance expected to accelerate in the second half alongside increased M&A and LBO activity.
Moody's forecasts US speculative-grade defaults declining to 3.0% by October 2026 from 5.3% a year earlier, supported by Fed rate cuts that reduce borrowing costs for leveraged companies. European defaults are projected to improve to 2.4% from 3.8%.
However, risks remain. Competition between broadly syndicated loan lenders and private credit has intensified, leading to weaker covenants and higher hidden leverage through off-balance-sheet structures. The defaults of Tricolor Holdings and First Brands Group, both present in many CLO portfolios, demonstrated the perils of hidden leverage. CLO ETFs have grown to over $50 billion in AUM, adding a new layer of market dynamics.
Real-World Examples
Example 1: The 2008 CDO Collapse
A pension fund bought $10 million of AAA-rated CDO tranches backed by subprime mortgages, yielding 5.5%. The rating agency model assumed a 2% default rate. When defaults hit 15%, the tranche was downgraded to junk and the market value dropped to $3 million. The pension fund had to write off $7 million.
Example 2: A Modern CLO Performing Well
An insurance company buys $5 million of AAA-rated CLO tranches backed by 250 corporate leveraged loans, yielding 4.5% (AAA spreads at approximately 130 basis points over benchmark rates in 2026). Five loans in the portfolio default, but the equity and mezzanine tranches absorb the losses. The AAA tranche continues paying on schedule. The CLO's diversification across 250 loans and the structural protection of senior tranches prevented losses.
Example 3: CLO Equity Risk
A specialized credit fund buys $2 million of CLO equity in a new issue CLO. The equity tranche targets a 12-15% return. In the first year, several loans in the portfolio are downgraded to CCC, and the CLO's weighted average spread declines as loans are refinanced at tighter spreads. The equity NAV drops 4.4% to approximately $1.91 million. The fund holds, and by year 3, improving loan performance and declining defaults restore the equity value.
Common Mistakes to Avoid
- Assuming all CDOs are toxic: Mortgage-backed CDOs caused the 2008 crisis, but CLOs (corporate loan CDOs) have a different risk profile and have performed well through multiple credit cycles. The structure is similar, but the collateral, diversification, and active management differ significantly.
- Ignoring tranche protection levels: A AAA CLO tranche can withstand 25-40% of the underlying loans defaulting before taking losses, depending on the deal structure. An equity tranche can be wiped out by 5-8% defaults. Know which tranche you are buying.
- Treating CLOs as static: Unlike 2008-era CDOs, CLO managers actively trade the loan portfolio. A well-managed CLO can sell deteriorating loans before they default and buy undervalued loans, creating value beyond the static structure.
- Overlooking hidden leverage risks: In 2025-2026, Moody's warned about off-balance-sheet structures and NAV lending that increase hidden leverage in leveraged loan portfolios. The Tricolor and First Brands defaults showed how hidden leverage can surprise CLO managers.
- Confusing CLO ETFs with direct CLO investments: CLO ETFs (now over $50 billion in AUM) provide diversified exposure but trade at market prices that can deviate from NAV. They also introduce fund-flow dynamics that direct CLO holdings do not have.
Related Concepts
- MBS: Mortgage-Backed Securities. The cousin of CDOs that pooled home loans. MBS backed by subprime mortgages were the raw material for the CDOs that failed in 2008.
- CDS: Credit Default Swaps. Derivative contracts used to insure or bet against CDOs. The "Big Short" was executed through CDS on CDOs.
- Hedge Fund: Many CLO equity investors and CDS speculators were hedge funds. Hedge funds remain active participants in the CLO market today.
- Private Equity: PE firms generate much of the leveraged loan supply that feeds CLOs through LBO financing. The competition between private credit and syndicated loans is reshaping the CLO market.
- Leverage: CDOs and CLOs are inherently leveraged structures. The tranching process creates leverage within the structure itself.
- Bond: CLO tranches are bond-like instruments with ratings, coupons, and maturities. CLO AAA tranches compete with corporate bonds for investor capital.
Key Points to Remember
- A CDO pools debt and slices it into tranches with different risk and return levels, paid in order from senior to equity.
- CDOs backed by subprime mortgages caused approximately $2 trillion in losses during the 2008 financial crisis.
- CLOs (corporate loan CDOs) survived and now represent a $1.53 trillion market as of December 2025.
- BofA Securities projects a record $600 billion in CLO issuance for 2026, driven by refinancings, resets, and new M&A activity.
- Moody's forecasts US speculative-grade defaults declining to 3.0% by October 2026, supported by Fed rate cuts.
- CLOs differ from 2008-era CDOs through better collateral, diversification (200-300 loans), active management, and floating-rate structures.
- Key risks include hidden leverage, weaker covenants from private credit competition, and tight spreads limiting manager flexibility.
Frequently Asked Questions
Q: How is a CDO different from an MBS? A: An MBS (Mortgage-Backed Security) is backed directly by a pool of mortgages. A CDO is often backed by MBS tranches or other CDOs: it is a secondary securitization. CDOs were typically more complex and opaque, with multiple layers of tranching and sometimes synthetic (CDS-based) rather than actual asset holdings.
Q: Are CDOs still being created? A: CDOs backed by mortgages are rare; the market never fully recovered. CLOs (backed by corporate loans) are active and growing, with $472 billion in US BSL CLO issuance in 2025 alone. Synthetic CDOs (backed by CDS) are used institutionally but more cautiously. The regulatory environment, capital requirements, and investor memory of 2008 have greatly reduced the riskiest forms of CDO issuance.
Q: What made CDO ratings so wrong in 2008? A: Three key failures. First, correlation assumption: models assumed mortgage defaults in different regions were relatively independent, but a national housing price decline correlated defaults everywhere simultaneously. Second, historical data limitations: post-WWII US housing data never showed a national price decline. Third, model gaming: structured finance teams worked backward from desired ratings to construct just-barely-qualifying tranches, while rating agencies competed for business from CDO issuers.
Q: Can CLOs cause another financial crisis? A: Most analysts consider a CLO-driven systemic crisis unlikely. CLOs hold corporate loans, not mortgages, and the corporate loan market is smaller and more transparent than the pre-crisis mortgage market. CLOs do not have the same degree of synthetic amplification (CDOs of CDOs) that existed in 2008. However, risks exist: hidden leverage, weaker covenants from private credit competition, and the growing CLO ETF market could amplify stress in a severe downturn.
Take Action
CDOs and CLOs sit in the advanced corner of structured finance. If you are building a portfolio, focus on the fundamentals first. Our investment return calculator can help you model returns on more accessible investments like stocks and bonds. For a broader understanding of fixed-income investing, read our guide on bonds explained and explore how dividend investing can provide steady income without the complexity of structured products.