*Disclosure: This article contains affiliate links. If you purchase through these links, we may earn a commission at no additional cost to you. We only recommend books we have personally read and genuinely believe in.
Quick Overview
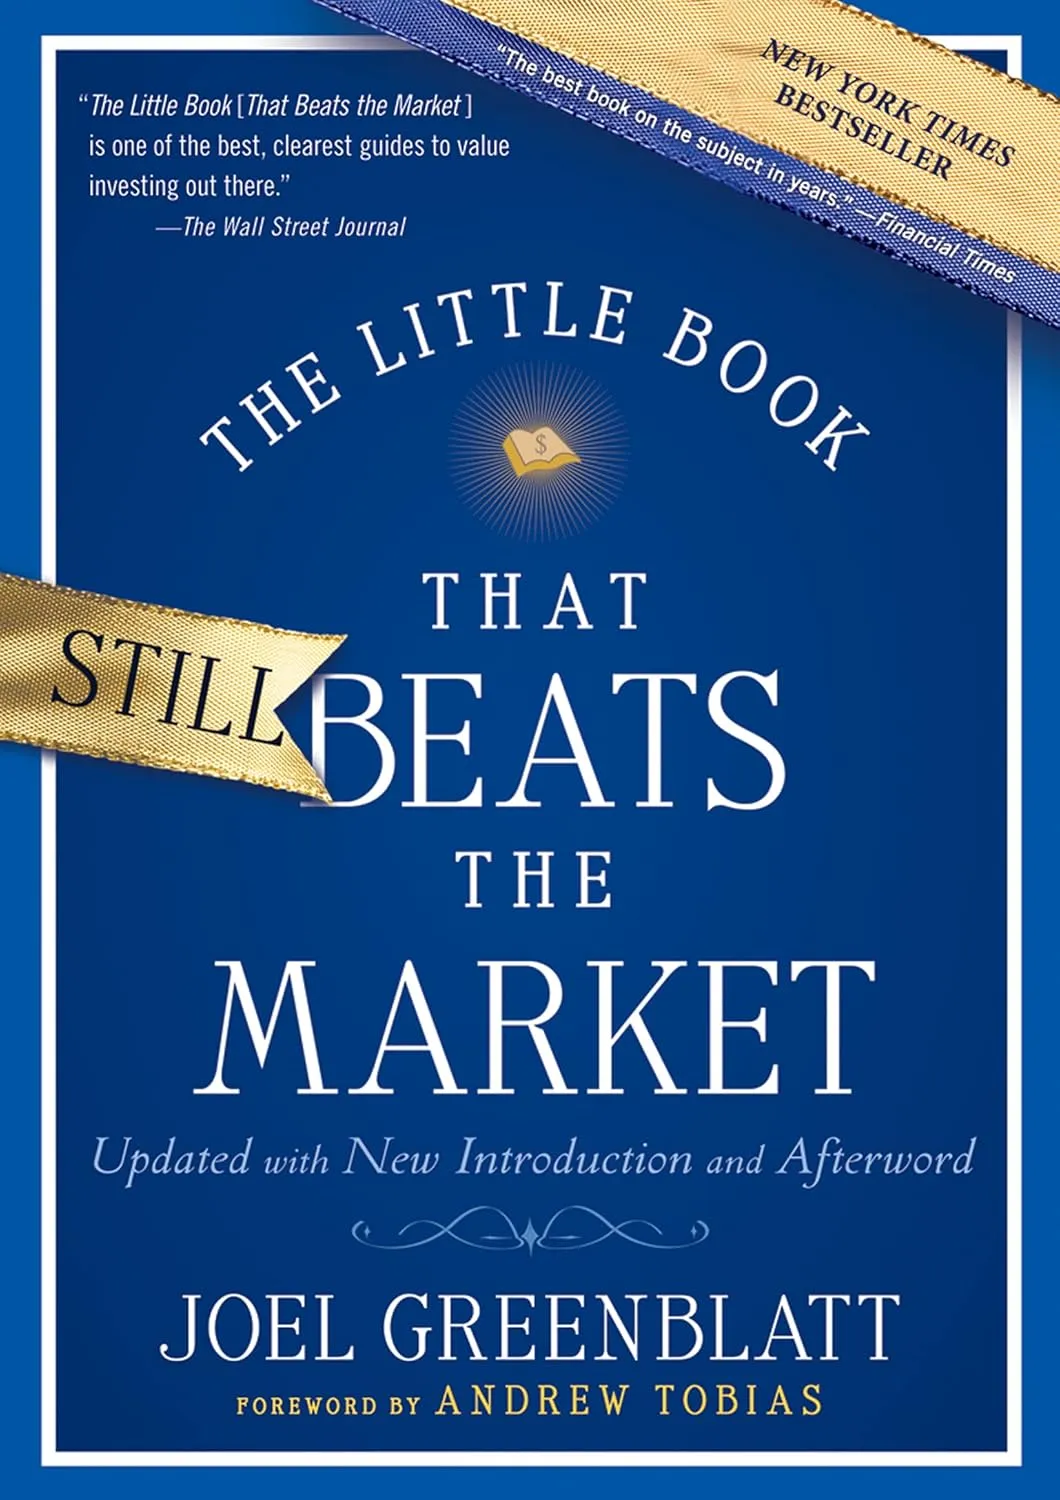
Joel Greenblatt ran Gotham Capital from 1985 to 1994, averaging 40% annual returns. After returning outside capital, he spent years developing a systematic formula that could replicate the core logic of value investing without requiring deep security analysis. The result is the "magic formula," a two-factor ranking system using earnings yield and return on capital. The book is accessible enough for a teenager while rigorous enough to change how professionals think about systematic value. I have backtested variations of the formula myself, and the results reveal an uncomfortable truth: the formula worked brilliantly in its original 1988-2004 backtest period, but post-publication performance has been mixed. A 2017-2026 backtest shows the formula underperforming the S&P 500. This review separates the timeless insights from the parts that need updating.
Book Details
| Attribute | Details |
|---|---|
| Title | The Little Book That Still Beats the Market |
| Author | Joel Greenblatt |
| Publisher | Wiley |
| Published | 2005 (Updated 2010) |
| Pages | 218 |
| Reading Level | Beginner to Intermediate |
| Amazon Rating | 4.6/5 stars |
Get Your Copy
Hardcover: Buy on Amazon
Kindle: Buy on Amazon
Audiobook: Buy on Amazon
About the Author
Joel Greenblatt founded Gotham Capital in 1985 with $7 million. He averaged 40% annualized returns over the next decade, one of the best records in hedge fund history. He later founded Gotham Asset Management and teaches the adjunct value and special situations investing class at Columbia Business School, continuing the tradition of Graham and Greenwald.
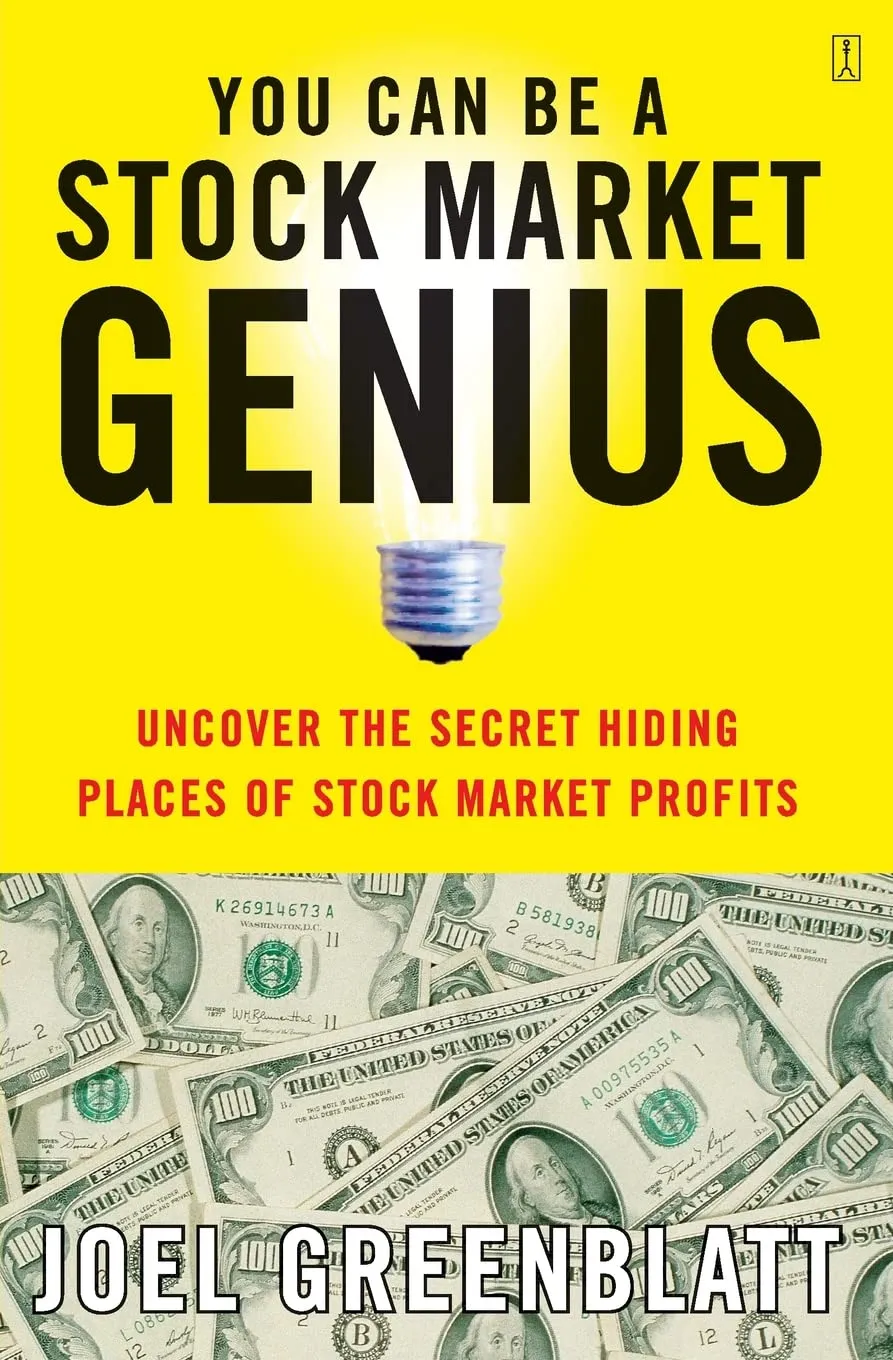
His book You Can Be a Stock Market Genius (1997) covers his specialty in special situations: spinoffs, mergers, restructurings. The Little Book That Still Beats the Market is his attempt to distill value investing into a formula anyone can follow.
The Magic Formula: Two Factors, One Ranking
Factor 1: Earnings Yield
Greenblatt uses earnings yield rather than P/E ratio because it allows direct comparison across companies with different capital structures:
Earnings Yield = EBIT / Enterprise ValueWhere:
Using EBIT removes the effect of debt financing. Using enterprise value accounts for the full capital structure.
Why this is better than P/E:
| Company | Market Cap | Net Income | P/E | EBIT | Enterprise Value | Earnings Yield |
|---|---|---|---|---|---|---|
| A (no debt) | $100M | $10M | 10x | $14M | $100M | 14% |
| B (heavy debt) | $100M | $10M | 10x | $14M | $200M | 7% |
Company B looks identical to A on P/E but is half as attractive because you are paying $200M for the same $14M in operating earnings. Earnings yield captures this correctly.
Factor 2: Return on Capital
Return on Capital = EBIT / (Net Fixed Assets + Net Working Capital)This measures how efficiently a business converts its invested capital into earnings. High ROIC businesses require less capital to grow and compound more efficiently.
| ROC | Business Quality |
|---|---|
| Below 10% | Below cost of capital; value-destroying |
| 10-15% | Average business |
| 15-25% | Good business |
| 25-40% | Excellent business |
| Above 40% | Exceptional franchise |
The Combined Ranking
The logic: this systematically finds businesses that are both cheap (high earnings yield) and good (high return on capital). Graham found cheapness. Buffett found quality. The magic formula finds both simultaneously.
The Original Backtest
Greenblatt backtested the formula from 1988 to 2004 on the 3,500 largest U.S. stocks:
| Time Period | Magic Formula Return | S&P 500 Return |
|---|---|---|
| 1988-2004 (17 years) | 30.8% annually | 12.4% annually |
| Rolling 1-year periods | Beat market in 76% | - |
| Rolling 3-year periods | Beat market in 95% | - |
| Rolling 5-year periods | Beat market in 97% | - |
$10,000 invested for 17 years at 30.8% would have grown to over $1 million. At 12.4%, it would have grown to about $71,600. The formula produced 14x the wealth of the index.
Why the Formula Works (and Will Continue to Work)
Greenblatt explains that the magic formula works precisely because it is painful to follow. In any given year, the formula underperforms the market approximately 1 in 4 years. Over 2-3 year periods, it underperforms roughly 1 in 20 times.
This intermittent underperformance causes most investors to abandon the formula during losing stretches, which reduces competition and preserves the premium.
Post-Publication Performance: The Uncomfortable Truth
The formula has received academic scrutiny since publication, and the results are mixed.
Academic Replications
| Study | Period | Finding |
|---|---|---|
| Gray & Vogel (2012) | 1964-2011 | Magic formula beats market by 5%/year |
| Carlisle (2012) | 1970-2010 | Earnings yield alone beats combined formula |
| Greenblatt's Gotham funds | 2009-2023 | Gross alpha of 3-5% annually (net fees lower) |
The 2017-2026 Backtest
A recent backtest ran a version of the magic formula from 2017 through early 2026 with survivorship bias removed (delisted companies kept in the record at last traded price):
| Metric | Magic Formula | S&P 500 |
|---|---|---|
| Total return (2017-2026) | 246.72% | 280.56% |
| CAGR | ~13.89% | ~15.01% |
| Initial $100K ending value | $346,718 | $380,564 |
The formula underperformed the S&P 500 over this 9.5-year window. The S&P 500 led for most of the period.
Year-by-year results show the pattern:
| Year | Magic Formula | S&P 500 |
|---|---|---|
| 2017 | $124,988 | $119,085 |
| 2018 | $125,002 | $126,396 |
| 2019 | $132,369 | $146,987 |
| 2020 | $139,463 | $174,481 |
| 2021 | $156,114 | $217,771 |
| 2022 | $176,194 | $199,907 |
| 2023 | $198,850 | $228,834 |
| 2024 | $265,197 | $304,392 |
| 2025 | $289,694 | $347,832 |
| 2026 | $346,718 | $380,564 |
Source: SledgeKey Backtests
The formula beat the S&P in 2017 but fell behind in 2019-2021 as growth stocks dominated. It narrowed the gap in 2022 when value recovered, then fell behind again as the AI-driven growth rally resumed.
Why the Formula Has Struggled
An analysis identifies three structural shifts:
1. The business landscape has changed. The largest companies by market cap are now software, semiconductor, and platform businesses (Microsoft, Apple, Nvidia, Amazon, Alphabet, Meta). These companies have tiny tangible asset bases relative to their earnings power. Their ROIC numbers, when computed the magic formula way (EBIT / (NWC + Net Fixed Assets)), are astronomical. Microsoft screens at 300%+ ROIC. They look cheap on the formula's metrics even at multi-trillion-dollar valuations.
Meanwhile, traditional cheap-on-EV/EBIT stocks are dominated by energy, deeply cyclical industrials, and old-economy retailers. These names have compressed margins and secular headwinds. The formula scoops them up because the math says they are cheap, but the qualitative reality is different.
2. Passive index fund dominance. In 2005, passive index funds held roughly 20% of U.S. equity AUM. Today the share is over 50%. Passive flows mechanically bid up large-cap names regardless of fundamental value. Stocks that should be cheap on magic formula metrics get no passive bid, so they stay cheap or get cheaper. The mean-reversion that the formula depends on takes longer to materialize.
3. Quantitative funds compete on the same screen. Dozens of quant funds now run Greenblatt-style strategies monthly rather than annually, with additional filters and institutional capital. This compresses the alpha for retail investors running the original formula.
The 2025 Value Resurgence: A Partial Recovery
The 2025 data offers some hope for formula adherents. Value was the best-performing factor globally in 2025, according to the Morningstar Factor Monitor Q4 2025. The Morningstar Global Value Factor Index posted strong performance, backed by intrasector stock selection in technology, financial services, and industrials.
A 50-year factor study shows the HML factor delivered 4.2% annualized returns from 2020-2025, after a -2.1% annualized return in 2010-2019. The value premium has not disappeared; it has compressed and become more cyclical.
The Simple and Advanced Formula
Simple Version (for most investors)
Use magicformulainvesting.com (Greenblatt's free website):
For taxable accounts, hold winners slightly past the one-year mark (long-term capital gains rate) and sell losers slightly before the one-year mark (short-term loss for maximum tax benefit).
Advanced Version: Adding Qualitative Filters
Greenblatt acknowledges the formula is improved by adding simple qualitative screens:
The last filter is the most important. If a company is cheap because its industry is structurally declining, the low ranking is a warning, not an opportunity.
Modern Improvements
Some practitioners have proposed updates to improve the formula's performance in the current market:
Key Concepts Explained for Beginners
Why Stocks Have Value
Greenblatt explains stocks as ownership in real businesses with impressive clarity: when you own a share of stock, you own a proportionate share of a business. That means you are entitled to your share of all the earnings that business generates in the future.
He uses a small business example: if you bought a store that earned $1,200 per year for $6,000 (5 P/E), that is a 20% earnings yield. You can evaluate whether that is a good price by comparing it to alternatives (savings account at 3%, bonds at 5%, other stores at different prices).
This reframing, stocks as pieces of businesses with definable earnings yields, cuts through the noise of market commentary.
Mr. Market as a Gift
Greenblatt's version of Graham's Mr. Market allegory: a business partner who offers to sell you his half of the business at a new price every day. Some days the price is very high; some days very low. You can either buy more, sell your share, or ignore him.
The key: daily price changes do not change the value of the underlying business. Only the fundamentals change its value. Mr. Market's mood is irrelevant unless you choose to trade with him.
Strengths & Weaknesses
What We Loved
Areas for Improvement
Who Should Read This Book
Highly Recommended For
Probably Not For
Comparison to Similar Books
| Book | Focus | Approach | Best For |
|---|---|---|---|
| The Little Book That Still Beats the Market | Systematic value | Two-factor formula | Rules-based value investing |
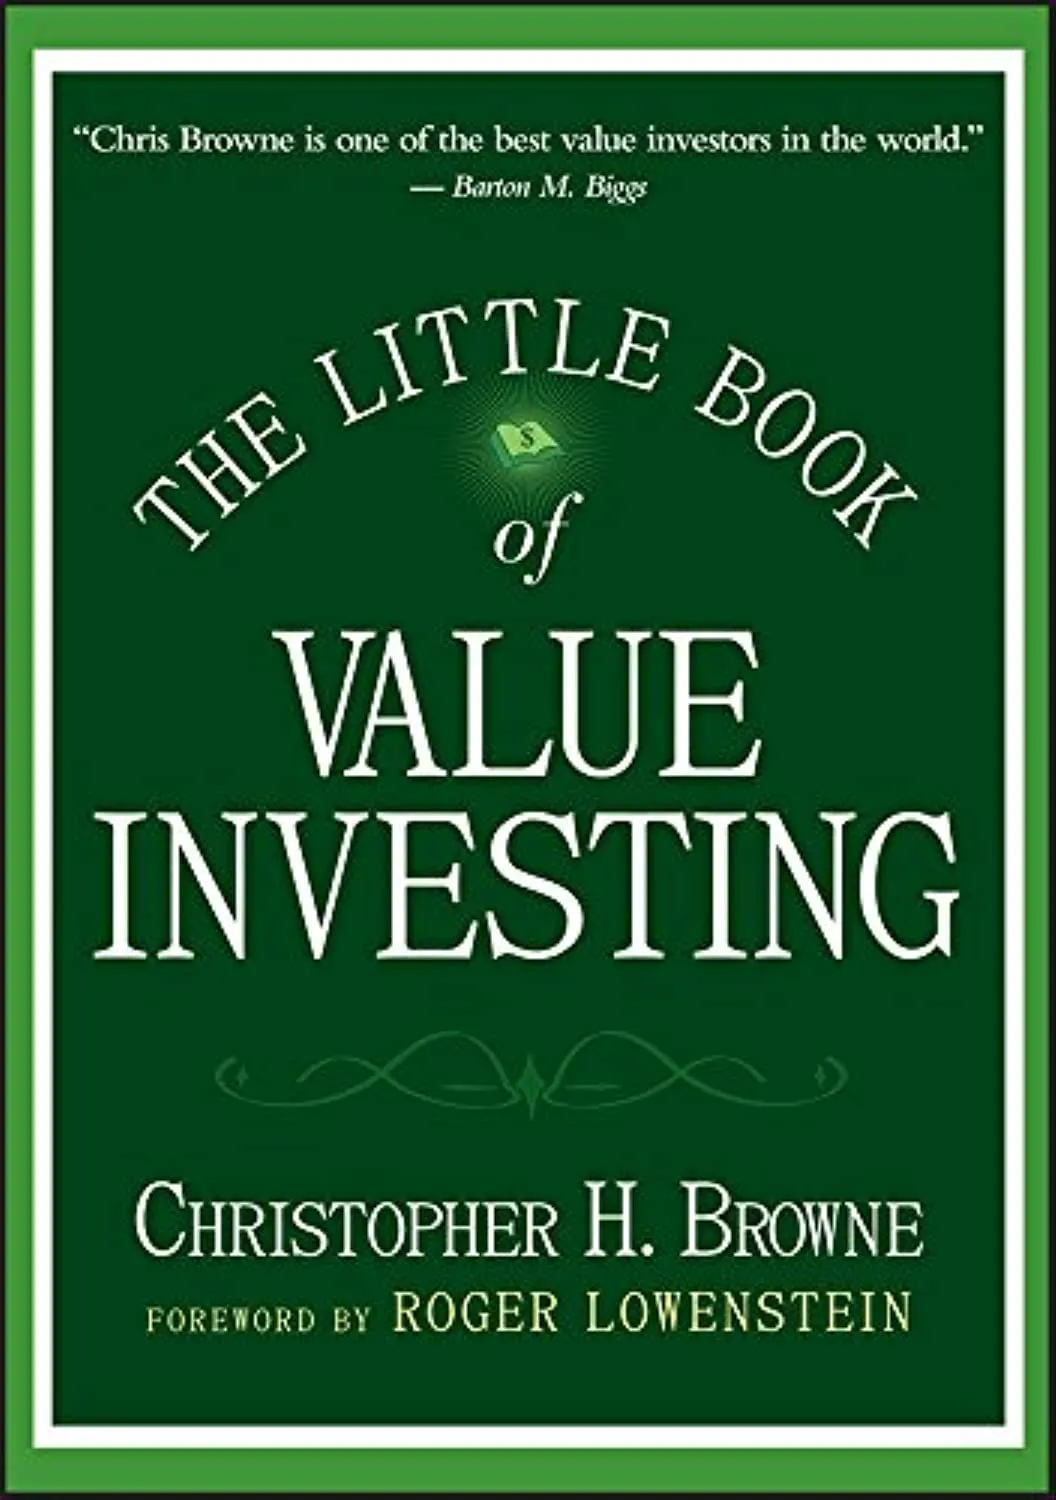
| The Little Book of Value Investing (Browne) | Value investing | Qualitative + quantitative | Stock-picking framework |
| The Intelligent Investor (Graham) | Value investing philosophy | Qualitative | Foundational framework |
| You Can Be a Stock Market Genius (Greenblatt) | Special situations | Event-driven | Advanced opportunities |
Read The Little Book That Still Beats the Market for the systematic approach. Read The Little Book of Value Investing for the qualitative framework. Read You Can Be a Stock Market Genius for special situations.
Implementation Guide
Using the Magic Formula in 2026
Step 1: Choose your account type
Step 2: Decide between the formula and value ETFs
Step 3: Apply modern filters
Step 4: Build the portfolio gradually
Step 5: Hold for one year, then rebalance
Step 6: Be prepared for multi-year underperformance
Frequently Asked Questions
Q: Does the magic formula still work today?
A: The 2017-2026 backtest shows the formula underperforming the S&P 500 by about 1% annually. The formula's edge has compressed since publication due to three factors: the changing business landscape (asset-light companies distort ROIC), passive index fund dominance (over 50% of AUM), and quant fund competition. The underlying logic (buy cheap, high-quality businesses) remains sound, but the mechanical implementation needs updating. Value was the best-performing factor in 2025, offering hope that the formula's cyclical underperformance may be reversing.
Q: Can I implement it in a Roth IRA?
A: Yes, and this is ideal. Tax-free growth eliminates the annual capital gains friction from portfolio turnover. The formula works best in tax-advantaged accounts.
Q: What is the minimum capital needed?
A: To own 20-30 positions with meaningful amounts, approximately $10,000-$20,000 is practical. Below that, transaction costs eat into returns. Many brokers now offer zero-commission trades, which has lowered this threshold.
Q: Is there an ETF that implements the formula?
A: Several value ETFs implement similar factor combinations. QVAL and IVAL target quality-value combinations. VTV and VIOV provide broad value exposure. These provide the exposure without the transaction costs of individual stock management. Greenblatt's Gotham funds implement variations of the strategy with long/short positioning.
Q: Should I use the formula or just buy a value ETF?
A: For most investors, a value ETF is the better choice. It captures most of the value premium, requires no ongoing effort, and avoids the tax drag from annual turnover. The formula is worth trying if you enjoy the process of stock selection and have a tax-advantaged account. Read our guide on index fund investing for a comparison of approaches.
Final Verdict
Rating: 4.4/5
The Little Book That Still Beats the Market is the clearest explanation of systematic value investing ever written. Its magic formula is elegant, its explanation of earnings yield is unsurpassed in accessibility, and its honest discussion of behavioral challenges makes it more useful than most books that oversell their strategies. The 2017-2026 backtest showing underperformance versus the S&P 500 is a legitimate concern, but it reflects structural changes in the market (passive dominance, asset-light business models) rather than a flaw in the underlying logic. Value was the best-performing factor in 2025, suggesting the formula's cyclical underperformance may be reversing. Essential reading for any investor considering a rules-based value approach, with the caveat that the mechanical implementation needs updating for the current market structure.
Get Your Copy
Hardcover: Buy on Amazon
Kindle: Buy on Amazon
Audiobook: Buy on Amazon
Prices current as of publication date. Free shipping available with Prime.