Leveraged Buyout (LBO)
Quick Definition
A leveraged buyout (LBO) is the acquisition of a company, public or private, using a large proportion of borrowed money (leverage), typically 60 to 80% of the purchase price. The target company's assets and future cash flows serve as collateral for the debt. Private equity firms execute LBOs by contributing a relatively small equity check and financing the rest with bank loans and high-yield bonds, amplifying their potential return on investment and their potential losses.
What It Means
The logic of an LBO is similar to buying a house with a mortgage: instead of paying $500,000 all-cash, you put down $100,000 and borrow $400,000, controlling a $500,000 asset with only $100,000 of your own money. If the house appreciates to $600,000, your $100,000 equity investment doubled (100% return) even though the asset only gained 20%.
In an LBO, the private equity firm plays the role of the homebuyer. The target company plays the role of the house. The acquired company's cash flows, its ability to generate profits, must be sufficient to service the debt payments, just as rental income might cover mortgage payments on an investment property.
The difference in scale and complexity is enormous. Major LBOs involve billions of dollars, sophisticated debt structures, operational transformation, and 5 to 7 year investment horizons. When they work, returns are spectacular. When they fail, companies go bankrupt and lenders lose money.
The 2026 LBO Market
The LBO market in 2026 is experiencing a significant slowdown. According to PitchBook, U.S. PE deal value fell to $177.3 billion in Q2 2026, down 37.5% from Q1 and 23.9% year-over-year. Global LBO volume dropped to $287.3 billion in Q2 2026, a 35.7% decline from Q1, representing the lowest LBO share of M&A in five years at just 24%. PE participation in overall M&A has fallen below 31% for the first time in a decade.
| 2026 LBO Market Metric | Data |
|---|---|
| U.S. PE deal value (Q2 2026) | $177.3 billion |
| Global LBO volume (Q2 2026) | $287.3 billion |
| LBO share of global M&A | 24% (5-year low) |
| U.S. LBO loan volume (1H 2026) | ~$90 billion |
| Direct lending share of LBO financing | 43% (down from 51% in 2025) |
| Global buyout dry powder | ~$1.3 trillion (Bain & Co.) |
| Software LBO value decline (YoY) | -65.7% |
Despite $1.3 trillion in unused PE capital waiting to be deployed, sponsors are pulling back from large, financing-dependent transactions. The Federal Reserve held rates unchanged through Q2 2026 at 3.50% to 3.75%, keeping debt costs elevated. Software deals have been hit hardest, with value dropping 65.7% year-over-year as investors parse the speed of AI disruption for legacy firms. Energy deals held firm on structural demand from data centers.
The Structure of an LBO
Typical Capital Structure
A $1 billion LBO might be financed as follows:
| Financing Layer | Amount | % of Total | Cost | Seniority |
|---|---|---|---|---|
| Senior secured bank loans | $400M | 40% | SOFR + 3 to 4% | First lien; paid first |
| Second lien loans | $150M | 15% | SOFR + 6 to 8% | Second priority |
| High-yield bonds | $250M | 25% | 8 to 11% fixed | Unsecured; paid after loans |
| Private equity equity | $200M | 20% | Expected 20 to 25% IRR | Last; residual claim |
| Total | $1,000M | 100% |
The PE firm contributes $200M in equity to buy a $1 billion company. If they sell the company in 5 years for $1.5 billion (after paying down debt to $600M during that time), the equity value grows to $900M, a 4.5x return on $200M invested.
Step-by-Step LBO Process
- Target identification: PE firm identifies a company with stable cash flows, strong market position, and potential for operational improvement
- Due diligence: Intensive financial, legal, and operational analysis of the target
- Financing commitment: Bank lenders and high-yield bond underwriters commit to provide debt
- Acquisition: PE firm acquires 100% of the target using equity plus debt
- Post-acquisition: PE firm installs new management (or works with existing), implements operational improvements, pays down debt
- Exit: After 4 to 7 years, PE firm sells the company via IPO, sale to strategic buyer, or secondary sale to another PE firm
What Makes an Ideal LBO Target
Private equity firms look for specific characteristics:
| Characteristic | Why It Matters |
|---|---|
| Stable, predictable cash flows | Must service debt payments reliably; no volatile revenues |
| Strong market position / pricing power | Ability to maintain margins under debt pressure |
| Low existing leverage | More borrowing capacity available |
| Tangible assets | Collateral for secured lenders |
| Cost reduction opportunities | Operational improvements to increase cash flow |
| Clear exit path | Strategic buyers would want this business |
| Non-cyclical industry | Avoids debt service problems during downturns |
Classic LBO candidates: retail chains with real estate, consumer brands, software companies with recurring revenue, healthcare services, food manufacturing.
Poor LBO candidates: airlines, automotive manufacturers, cyclical commodity businesses. High fixed costs and volatile cash flows create dangerous debt service risk.
Real-World LBO Examples
The RJR Nabisco LBO (1989)
- Deal size: $31.4 billion (largest LBO in history at the time)
- Buyer: KKR (Kohlberg Kravis Roberts)
- Debt: approximately $29 billion (approximately 92% of purchase price)
- Outcome: Company struggled under the enormous debt load; eventually broken up. KKR ultimately made modest returns, far below expectations.
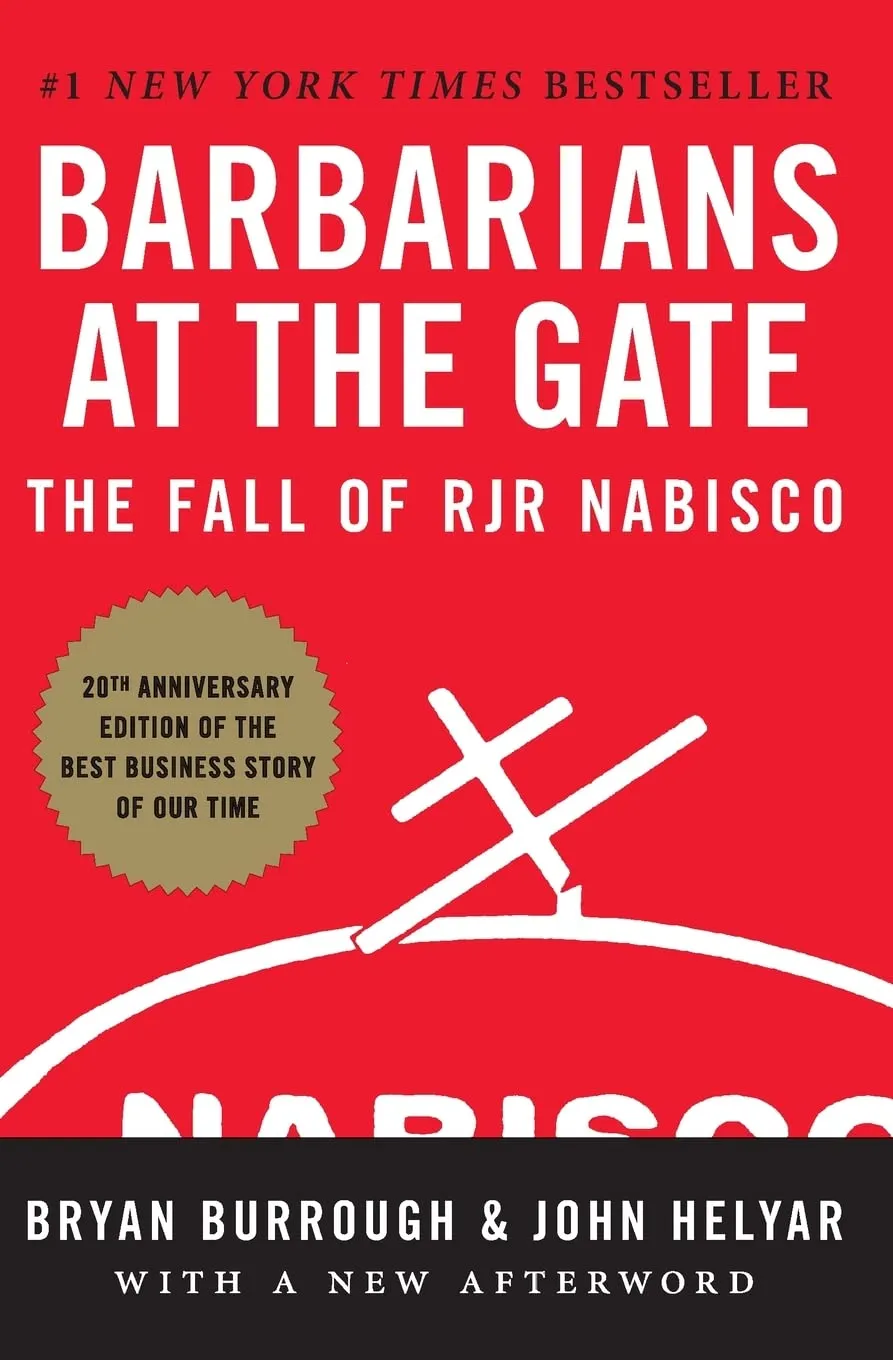
- Legacy: Defined an era; subject of the book "Barbarians at the Gate"
The Dell Technologies LBO (2013)
- Deal size: $24.9 billion
- Buyer: Michael Dell and Silver Lake Partners
- Equity: approximately $9 billion (approximately 36%)
- Outcome: Dell went private, transformed into enterprise IT company, re-IPO'd in 2018 at over $100B valuation. A major success.
Hilton Hotels LBO (2007 to 2013)
- Deal size: $26 billion (by Blackstone)
- Timing: Right before the 2008 financial crisis
- Outcome: Despite near-disaster (hotel occupancy collapsed in 2008 to 2009), Blackstone held the position, restructured the debt, and eventually IPO'd Hilton in 2013, generating approximately $14 billion in profits on the investment. One of the most profitable PE investments ever.
LBO Returns: The Math
The leverage effect on equity returns:
Scenario: PE firm buys a company for $1 billion (4x debt, 1x equity = $800M debt, $200M equity). Company grows EBITDA from $100M to $150M over 5 years. Exit at same 10x EBITDA multiple = $1.5B enterprise value.
| No Leverage (All Equity) | With Leverage (80/20) | |
|---|---|---|
| Purchase price | $1,000M | $1,000M |
| Equity invested | $1,000M | $200M |
| Debt | $0 | $800M (paid down to $600M) |
| Exit value | $1,500M | $1,500M |
| Equity at exit | $1,500M | $900M ($1,500M minus $600M debt) |
| Return on equity | 1.5x (50% total) | 4.5x (350% total) |
| Annualized IRR (5yr) | approximately 8.5% | approximately 35% |
Leverage amplifies the same underlying business improvement from an 8.5% annual return to 35%. That is the power and risk of the LBO model.
LBO Risk: When It Goes Wrong
The same leverage that amplifies returns also amplifies losses:
What can go wrong:
- Revenue declines (recession, competition)
- Margin compression (cost inflation not passed through)
- Interest rate increases (floating rate debt becomes expensive)
- Failed integration or operational improvements
- Exit market closes (no buyers, depressed valuations)
When a PE firm overpays or the business underperforms, the equity cushion is wiped out and lenders face losses. Companies go bankrupt. Employees lose jobs, suppliers lose contracts, pension obligations may be impaired.
Notable LBO failures: Toys R Us (2017 bankruptcy), Energy Future Holdings (2014 bankruptcy after KKR's $45B LBO of TXU), Sears Holdings.
2026 LBO Financing Trends
The financing environment for LBOs shifted notably in 2026:
| Trend | Detail |
|---|---|
| Direct lending share decline | Direct lenders held 43% of LBO financing in 1H 2026, down from 51% in full year 2025 |
| Syndicated loan recovery | Syndicated LBO loans reached $50.6B in 1H 2026, up 51% year-over-year |
| KKR North America Fund XIV | $23 billion close, one of the largest PE funds ever raised |
| Add-on dominance | Add-ons accounted for 74% of U.S. PE deal activity in 2025, holding steady in 2026 |
| Public-to-private drought | Large public-to-private transactions were almost non-existent in early 2026 |
| AI-driven sector rotation | Software LBO value dropped 65.7% YoY; energy held firm on data center demand |
Morgan Stanley's midyear 2026 outlook notes that PE deal flow has yet to fully ignite despite improving broader M&A conditions. The middle market, where a 20%+ increase from current levels would unlock capital deployment, remains constrained by interest rate sensitivity and inflation uncertainty.
Key Points to Remember
- An LBO acquires a company using 60 to 80% borrowed money, amplifying returns on a small equity investment
- The target company's own cash flows service the debt, making stable cash flow generation the number one LBO requirement
- The debt stack typically includes bank loans (first lien), second lien loans, and high-yield bonds, each with different priority and cost
- Leverage amplifies equity returns dramatically when the deal works, and destroys equity when it fails
- The ideal LBO candidate has stable cash flows, strong market position, low existing debt, and operational improvement potential
- In Q2 2026, global LBO volume fell to $287.3 billion, the lowest share in 5 years, as higher rates and AI disruption dampened activity
- Most major LBOs are executed by private equity firms (KKR, Blackstone, Apollo, Carlyle) with 5 to 7 year investment horizons
Common Mistakes to Avoid
- Confusing LBO with hostile takeover: Most LBOs are negotiated; the management often participates (see Management Buyout). Hostile takeovers involve unwanted acquisition attempts, a separate concept.
- Assuming all PE/LBO investments are high risk: Diversified PE funds spread risk across many investments; individual LBOs vary enormously in quality. Add-on acquisitions for existing portfolio companies carry different risk profiles than platform LBOs.
- Ignoring the interest rate sensitivity: LBOs done at low rates face cost increases when rates rise. Many 2020 to 2022 vintage LBOs faced pressure as rates rose sharply in 2022 to 2023. In 2026, the Fed's pause at 3.50% to 3.75% continues to constrain new deal economics.
- Missing the operational value creation story: The best LBOs are not financial engineering exercises but genuine operational transformations that create real business value. Add-on strategies driving revenue growth and cost synergies accounted for 74% of U.S. PE deal activity in 2025.
Related Concepts
LBOs connect to several other financial concepts. Private equity firms are the primary LBO buyers. High-yield bonds and syndicated loans provide the debt financing. Mergers and acquisitions encompass the broader deal environment. Management buyouts are a variant where existing management participates in the buyout. Synergy drives the strategic rationale for many acquisitions. Read our guides on real estate crowdfunding and how equity stock options work for related investment concepts.
Frequently Asked Questions
Q: How do private equity firms make money on LBOs? A: Three main value creation levers: (1) Financial engineering. Leverage amplifies equity returns when the business is sold at a higher value. (2) Operational improvement. Cutting costs, growing revenue, improving management, expanding internationally. (3) Multiple expansion. Buying at a lower valuation multiple and selling at a higher one (e.g., buying at 8x EBITDA and selling at 12x). The best PE firms create value primarily through operations, not just financial leverage.
Q: What is the difference between an LBO and a regular acquisition? A: A regular (strategic) acquisition is typically done by a company buying another company using its own cash, stock, or modest amounts of debt. The acquiring company operates the target as part of its business long-term. An LBO is done by a financial buyer (PE firm) using mostly borrowed money, with the intent to resell the company in 5 to 7 years for a profit. The LBO's defining feature is the high debt load and the financial-investor motivation.
Q: Can individual investors participate in LBOs? A: Not directly. LBOs require institutional capital and sophisticated deal-making capabilities. Individuals can gain indirect exposure through: (1) publicly traded PE firms (Blackstone, KKR, Apollo, all publicly listed); (2) PE-focused ETFs; (3) high-yield bond ETFs that hold LBO debt; or (4) accredited investor allocations to PE funds. Most direct PE fund investing requires minimum investments of $250,000 to $5 million and long lock-up periods.
Q: Why has LBO activity slowed in 2026? A: Three factors. First, the Federal Reserve held interest rates at 3.50% to 3.75% through Q2 2026, keeping debt financing costs elevated. Second, AI disruption has made PE firms cautious about software targets, which historically drove large LBO volume. Third, geopolitical uncertainty, including a Mideast war in 2026, drove buyers to the sidelines. Despite $1.3 trillion in dry powder, sponsors are being extremely deliberate about deal selection and pricing.