*Disclosure: This article contains affiliate links. If you purchase through these links, we may earn a commission at no additional cost to you. We only recommend books we genuinely believe in.
Quick Overview
The Intelligent Asset Allocator is the quantitative companion to Bernstein's more accessible Four Pillars of Investing. Published in 2000, it covers the mathematics of diversification, efficient frontier construction, factor risk premiums, and the historical return data that justifies a globally diversified index fund portfolio. It requires more statistical comfort than most investing books but rewards readers with a deeper understanding of why modern portfolio theory works in practice. Despite being written before ETFs became dominant, the book's core principles have been validated by subsequent research, including a dramatic 2025 revival of factor investing that silenced many critics.
Book Details
| Attribute | Details |
|---|---|
| Title | The Intelligent Asset Allocator: How to Build Your Portfolio to Maximize Returns and Minimize Risk |
| Author | William J. Bernstein |
| Publisher | McGraw-Hill |
| Published | 2000 |
| Pages | 225 |
| ISBN-13 | 978-0071385293 |
| Reading Level | Advanced |
| Amazon Rating | 4.5/5 stars |
Get Your Copy
Paperback: Buy on Amazon
Kindle: Buy on Amazon
About the Author
William Bernstein is a neurologist-turned-financial-theorist who runs Efficient Frontier Advisors, a fee-only RIA in Oregon. His ability to apply statistical thinking from medicine to finance gives him an unusual analytical rigor. The Intelligent Asset Allocator was his first book, written before The Four Pillars of Investing, and shows his thinking in its most mathematically explicit form.
Bernstein has since become more cautious about factor tilts, arguing in recent writing that the premiums may be partially arbitraged away given how widely known they are. But the 2025 factor revival, which saw international value funds outperform the S&P 500 by over 18 percentage points in five months, vindicated his original thesis that factor premiums are cyclical, not dead.
The Core Question: How Do You Build the Best Portfolio?
The book addresses the central problem of portfolio construction: given a universe of assets with different expected returns, risks, and correlations, how do you combine them to maximize return for a given level of risk?
This is the question Harry Markowitz answered with Modern Portfolio Theory (MPT) in 1952. Bernstein explains MPT clearly, applies it to real asset classes with historical data, and draws practical conclusions for individual investors.
The Mathematics of Diversification
Why Correlation Is Everything
Two assets with identical expected returns and risks can produce very different portfolio outcomes depending on how they correlate:
Effect of correlation on portfolio volatility:
| Asset A Return | Asset B Return | Correlation | Portfolio Volatility |
|---|---|---|---|
| 10% (SD: 20%) | 10% (SD: 20%) | +1.0 | 20% (no benefit) |
| 10% (SD: 20%) | 10% (SD: 20%) | 0.0 | 14.1% (29% reduction) |
| 10% (SD: 20%) | 10% (SD: 20%) | -1.0 | 0% (complete elimination) |
When two assets are perfectly negatively correlated, combining them eliminates all volatility while preserving the return. In practice, no two real asset classes have -1.0 correlation, but many have low enough correlation that combining them substantially reduces portfolio volatility.
Historical Correlations Between Asset Classes
| Asset Class Pair | Historical Correlation |
|---|---|
| U.S. large cap / U.S. small cap | 0.78 |
| U.S. stocks / International stocks | 0.45-0.60 |
| U.S. stocks / Emerging markets | 0.30-0.50 |
| U.S. stocks / U.S. bonds | 0.00-0.20 |
| U.S. stocks / REITs | 0.55-0.65 |
| U.S. stocks / Gold | -0.05 to 0.15 |
The lower the correlation, the greater the diversification benefit. U.S. stocks and bonds near zero correlation means adding bonds reduces portfolio volatility significantly without eliminating return.
Important caveat (Bernstein acknowledges): Correlations are not stable. During financial crises (2008, 2020), correlations between most risk assets spike toward 1.0. Diversification provides the least protection exactly when you need it most.
The Efficient Frontier
The efficient frontier is the set of portfolios that provide the maximum expected return for each level of risk (or equivalently, minimum risk for each expected return level).
Simplified two-asset efficient frontier (stocks and bonds):
| Allocation | Expected Return | Expected Volatility |
|---|---|---|
| 100% bonds | 4% | 8% |
| 80% bonds / 20% stocks | 5.2% | 7.1% |
| 60% bonds / 40% stocks | 6.4% | 8.2% |
| 40% bonds / 60% stocks | 7.6% | 11.5% |
| 20% bonds / 80% stocks | 8.8% | 15.0% |
| 100% stocks | 10% | 18% |
The counterintuitive result: moving from 100% bonds to 80% bonds/20% stocks actually reduces portfolio volatility below the all-bond portfolio while increasing expected return. This is the diversification "free lunch" that Markowitz discovered.
The Return Premium Analysis
Bernstein analyzes the historical return premiums of different asset classes, which forms the basis for factor-tilted portfolio construction:
Domestic Factor Premiums (U.S., 1926-2000)
| Factor | Annual Premium vs. S&P 500 |
|---|---|
| Small cap (size factor) | +2.1% |
| Value (HML factor) | +3.8% |
| Small cap value (combined) | +4.9% |
International Premiums
| Region | Historical Annual Return |
|---|---|
| U.S. large cap | 10.4% |
| U.S. small cap | 12.5% |
| International developed (EAFE) | 9.6% |
| International small cap | 12.8% |
| Emerging markets | 13.2% (with very high volatility) |
Has the factor premium held up since 2000?
The factor premium story has been more complicated than Bernstein's original data suggested. The value premium essentially disappeared from 2007 to 2024 as growth stocks dominated. Many commentators declared factor investing "dead."
Then 2025 delivered a dramatic vindication. According to Morningstar data cited by The Evidence Investor, the DFA International Value fund (DFIVX) returned 17.97% year-to-date through May 2025, compared to -0.17% for the S&P 500. That is an 18.14 percentage point outperformance in just five months.
Dimensional Fund Advisors' international factor funds delivered persistent premiums over the full 1996-2025 period: DISVX (International Small Value) returned 7.95% annualized, DFISX (International Small) returned 7.02%, and DFIVX (International Value) returned 6.66%, all ahead of the 5.45% MSCI EAFE return. In emerging markets, DEFVX (Emerging Value) returned 9.75% annualized and DEMSX (Emerging Small) returned 10.51%, both significantly ahead of the 7.75% MSCI Emerging Markets return.
The lesson Bernstein teaches and 2025 confirmed: factor premiums are cyclical, not structural. They require patience measured in decades. Investors who abandoned factor tilts during the growth-dominated 2014-2024 period missed the dramatic 2025 reversal.
Rebalancing: The Mechanics and Magic
Bernstein provides quantitative analysis of how rebalancing produces a "rebalancing bonus":
How rebalancing generates excess return:
Consider two uncorrelated assets each returning 5% annually but with high volatility (30% standard deviation):
Rebalancing methods compared:
| Method | Trigger | Pros | Cons |
|---|---|---|---|
| Annual calendar | Once per year | Simple | May miss large drifts |
| 5% threshold | When allocation drifts 5% from target | Responsive | More frequent trading |
| 5%/25% hybrid | 5 percentage points OR 25% relative drift | Balanced | Slightly complex |
For most investors, annual rebalancing is sufficient. For taxable accounts, using new contributions to rebalance (directing new money to underweight asset classes) minimizes tax friction.
Use our investment return calculator to model how different rebalancing strategies affect your long-term returns.
The Historical Risk Premium Data
U.S. Asset Class Returns (1926-2024, updated)
| Asset Class | Annual Return | Standard Deviation | Worst Year |
|---|---|---|---|
| T-bills | 3.3% | 3.1% | +0.0% |
| 5-year Treasuries | 4.9% | 5.6% | -5.1% |
| 20-year Treasuries | 5.1% | 9.8% | -14.9% |
| S&P 500 | 10.4% | 19.8% | -43.3% |
| U.S. small cap | 11.8% | 31.0% | -58.0% |
| U.S. small cap value | 13.2% | 27.5% | -54.5% |
Key observations:
Portfolio Construction Recommendations
Bernstein's recommended portfolios for different risk tolerances:
Conservative Portfolio (30% stocks)
| Asset | Allocation |
|---|---|
| Short-term bonds | 40% |
| Intermediate bonds | 30% |
| U.S. total market | 15% |
| International | 15% |
Moderate Portfolio (60% stocks)
| Asset | Allocation |
|---|---|
| U.S. total market | 25% |
| U.S. small cap value | 10% |
| International developed | 15% |
| International small cap | 10% |
| Short-term bonds | 20% |
| Intermediate bonds | 20% |
Aggressive Portfolio (80% stocks)
| Asset | Allocation |
|---|---|
| U.S. total market | 25% |
| U.S. small cap value | 15% |
| International developed | 20% |
| International small cap | 10% |
| Emerging markets | 10% |
| Short-term bonds | 10% |
| Intermediate bonds | 10% |
Behavioral Danger: Tracking Error Regret
Bernstein identifies "tracking error regret" as the primary obstacle to maintaining a factor-tilted portfolio. When your portfolio underperforms a simple S&P 500 index fund for an extended period (which happens regularly), the psychological pressure to abandon the strategy is intense.
Historical underperformance periods for small cap value vs. S&P 500:
| Period | Small Cap Value Underperformance | What Happened Next |
|---|---|---|
| 1984-1988 | -5% per year | Reversed sharply 1989-1993 |
| 1993-1998 | -10% per year (tech boom) | Reversed 2000-2006 |
| 2007-2024 | -2% per year (growth dominance) | Reversed dramatically in 2025 |
An investor who abandoned small cap value in 1999 after 6 years of underperformance missed its subsequent outperformance. An investor who abandoned it in 2024 after 17 years of underperformance missed the 2025 reversal. The factor premium requires patience measured in decades, not years.
The Sharpe ratio of factor-tilted portfolios may look worse than the S&P 500 during growth-dominated periods because the tracking error adds volatility without apparent reward. But over full market cycles, the risk-adjusted returns of diversified factor portfolios have historically been superior.
Strengths & Weaknesses
What We Loved
Areas for Improvement
Who Should Read This Book
Highly Recommended For
Probably Not For
Comparison to Similar Books
| Book | Focus | Difficulty | Best For |
|---|---|---|---|
| The Intelligent Asset Allocator (Bernstein) | Quantitative portfolio theory | Advanced | Analytical investors |
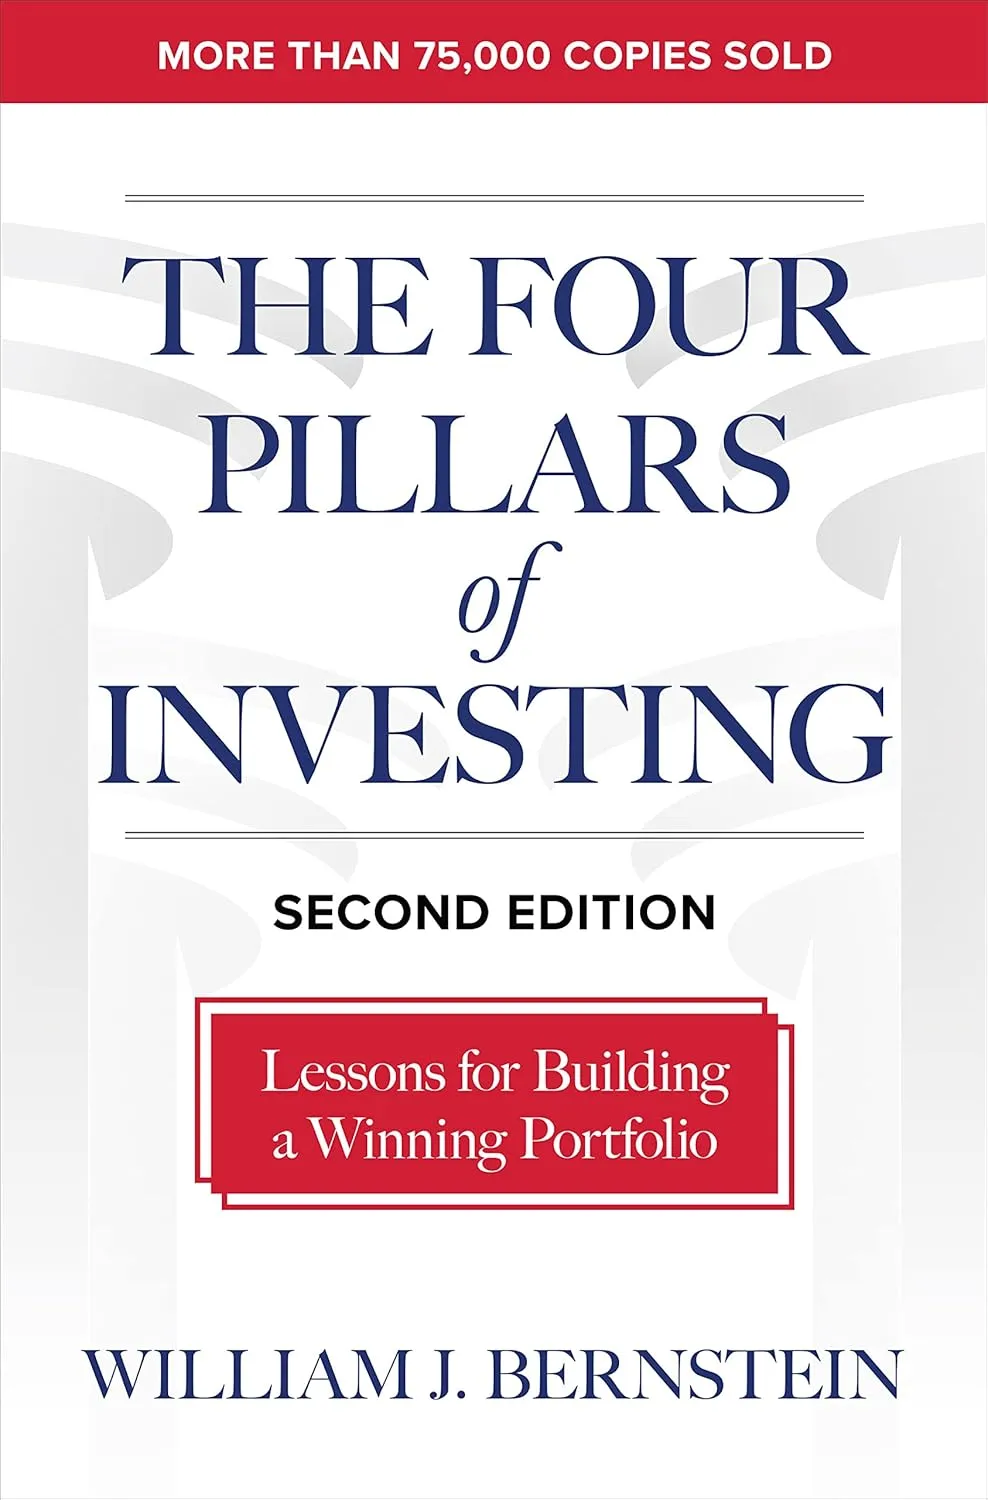
| The Four Pillars of Investing (Bernstein) | Broader framework | Intermediate | Serious self-directed investors |
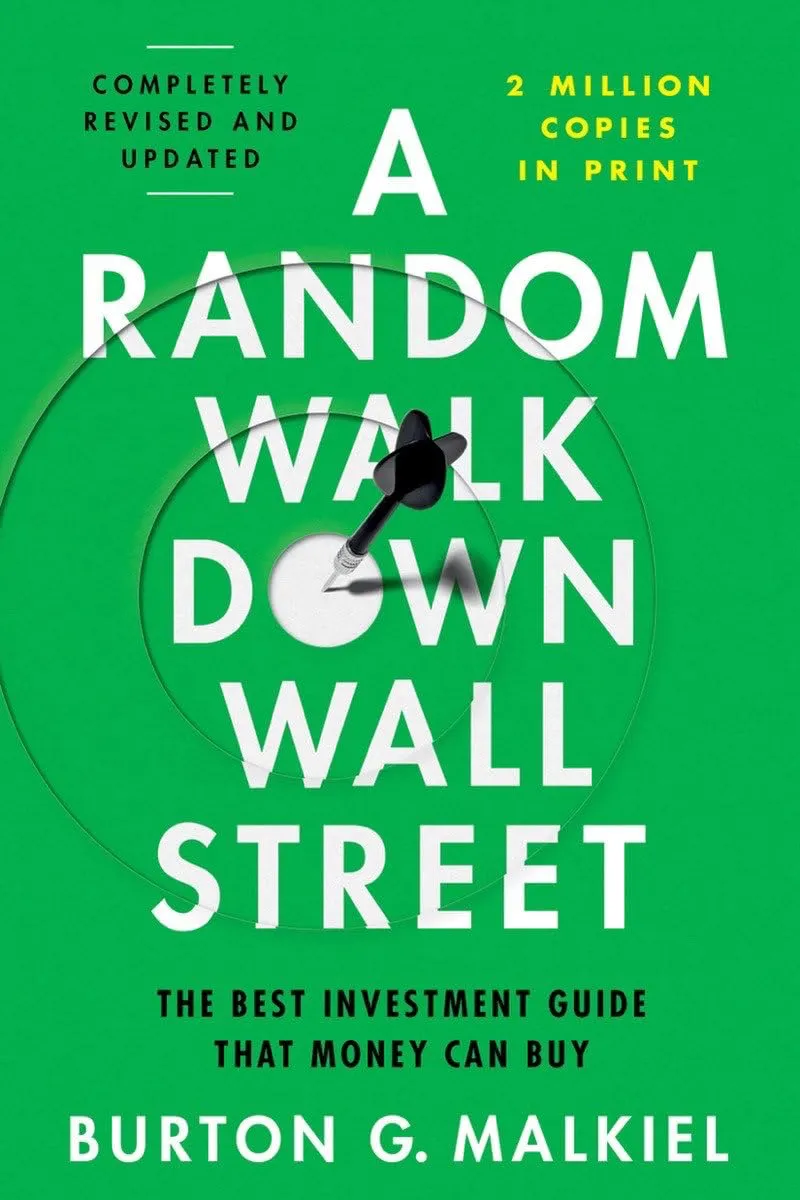
| A Random Walk Down Wall Street (Malkiel) | Market efficiency, accessible | Beginner-Intermediate | General investors |
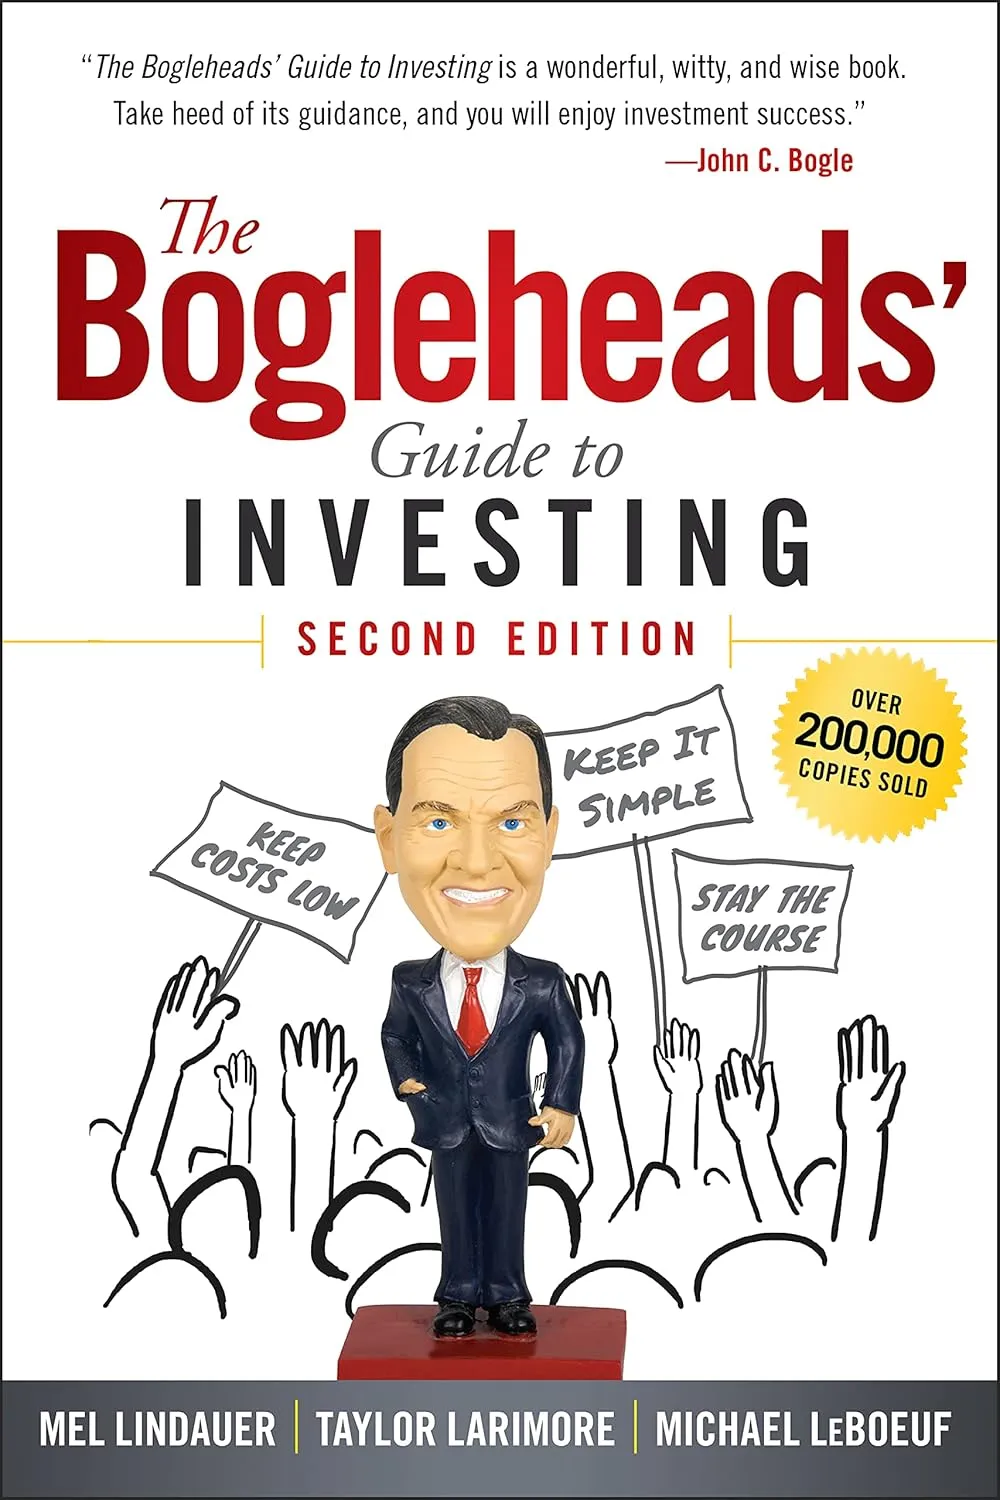
| The Bogleheads' Guide to Investing | Practical implementation | Beginner | Most investors |
| Rational Expectations (Bernstein) | Advanced investing across lifecycle | Advanced | Experienced investors |
Read The Four Pillars first for the framework, then The Intelligent Asset Allocator for the math.
Implementation Guide
30-Day Study and Application Plan
Week 1: Read and absorb the math
Week 2: Evaluate your current allocation
Week 3: Decide on factor tilts
Week 4: Set up rebalancing
Frequently Asked Questions
Q: Is this better or worse than The Four Pillars of Investing?
A: Different. The Intelligent Asset Allocator is more quantitative and was written first. The Four Pillars is more accessible and covers broader ground including history and psychology. Read The Intelligent Asset Allocator if you want the numbers. Read The Four Pillars if you want the complete framework.
Q: Has the factor premium data held up since 2000?
A: Mixed, then dramatically validated. The small-cap premium was weak from 2007 to 2024. The value premium essentially disappeared during the growth dominance period. Then in 2025, international value funds outperformed the S&P 500 by over 18 percentage points in five months. DFA's international factor funds delivered persistent premiums over the full 1996-2025 period. Bernstein himself has become more cautious about factor tilts in recent writing, but the 2025 data suggests the premiums are cyclical rather than dead.
Q: Do I need a math background?
A: High school algebra is sufficient for most chapters. The standard deviation and correlation concepts require careful reading but are explained from scratch. The efficient frontier optimization section is the most mathematical.
Q: Should I buy this book if I already own The Four Pillars?
A: Only if you want the mathematical foundation behind the portfolio recommendations. The Four Pillars covers the same ground more accessibly. If you are satisfied with a three-fund portfolio and do not want to understand the math behind it, skip this book.
Q: Are the specific fund recommendations still valid?
A: The specific funds Bernstein recommended in 2000 have been superseded by better, cheaper options. The asset class allocations are still valid. Use VTI, VXUS, AVUV (small cap value), AVDV (international small cap value), and BND as modern equivalents of what Bernstein recommended.
Final Verdict
Rating: 4.5/5
The Intelligent Asset Allocator is the most rigorous treatment of portfolio construction available to ordinary investors. Its data-driven analysis of asset class returns, correlations, and factor premiums provides the quantitative foundation that most investing books assert without proving. The 2025 factor investing revival, which saw international value funds outperform the S&P 500 by over 18 percentage points in five months, vindicated Bernstein's core thesis that factor premiums are real but require extraordinary patience.
Essential reading for the analytically minded investor who wants to understand the mathematics behind their portfolio. Read The Four Pillars first. If you want the numbers, read this book second.
Get Your Copy
Paperback: Buy on Amazon
Kindle: Buy on Amazon
Prices current as of publication date. Free shipping available with Prime.