*Disclosure: This article contains affiliate links. If you purchase through these links, we may earn a commission at no additional cost to you. We only recommend books we genuinely believe in.
Quick Overview
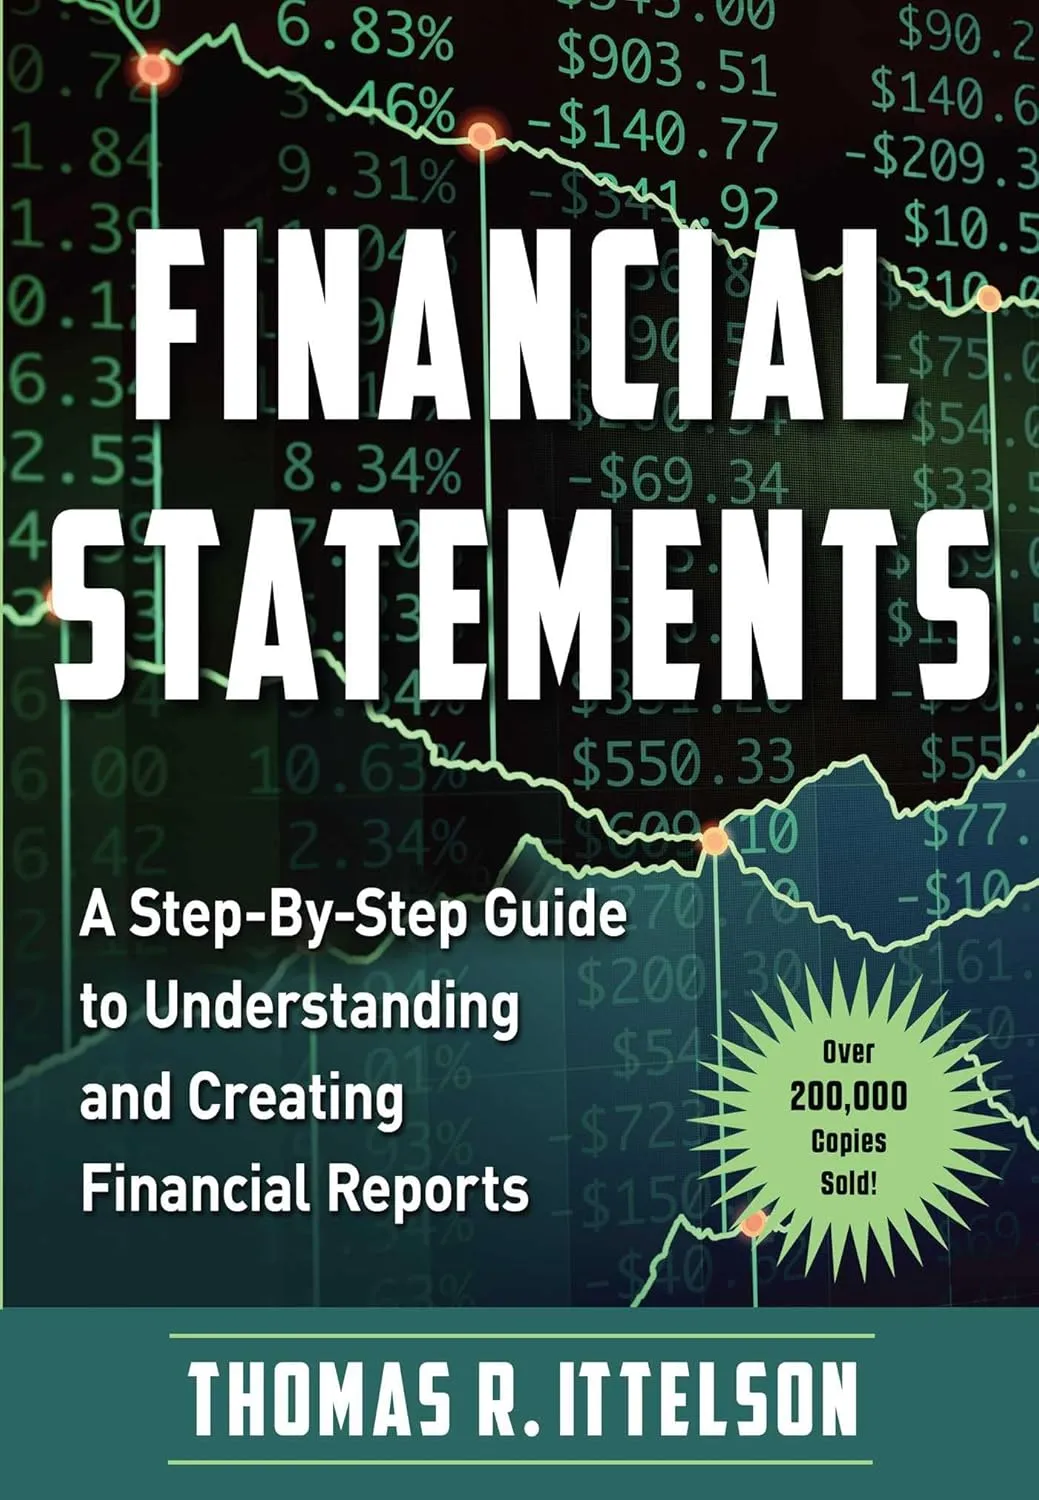
Most accounting textbooks lose readers in the first chapter by front-loading terminology before building any intuition for what the numbers mean. Thomas Ittelson flips that approach. He builds a fictional company called AppleSeed Enterprises transaction by transaction, showing how each sale, loan, and equipment purchase ripples across all three financial statements simultaneously. By the time he introduces formal vocabulary, you already understand the mechanics. The 2022 edition (304 pages, over 200,000 copies sold) adds sections on nonprofit accounting and pricing for profitability, making it even more practical than earlier versions.
Book Details
| Attribute | Details |
|---|---|
| Title | Financial Statements |
| Author | Thomas R. Ittelson |
| Publisher | Red Wheel/Weiser (formerly Career Press) |
| Latest Edition | September 2022 |
| Pages | 304 |
| ISBN-13 | 978-1632652072 |
| Reading Level | Beginner |
| Amazon Rating | 4.7/5 stars |
Get Your Copy
Paperback: Buy on Amazon
Kindle: Buy on Amazon
About the Author
Thomas Ittelson is a scientist, businessman, and teacher who spent decades helping entrepreneurs design financial projections and business plans. His consulting work has helped raise more than $500 million in startup equity capital. He wrote Financial Statements because he kept meeting smart, capable professionals who could not read a balance sheet or interpret a cash flow statement. His visual, step-by-step method reflects years of teaching financial literacy to engineers, scientists, and business owners who needed accounting for their work but had no formal training in it.
The Three Financial Statements
Every public company produces three financial statements that together tell the complete story of its financial condition. Ittelson's genius is showing how every single business transaction affects all three at once.
The Income Statement (P&L)
The income statement shows revenues and expenses over a period of time. It answers the simplest question in business: did the company make money?
Basic income statement structure:
Revenue (Sales)
- Cost of Goods Sold (COGS)
= Gross Profit
- Operating Expenses (SG&A, R&D, etc.)
= Operating Income (EBIT)
- Interest Expense
+ Interest Income
= Pre-Tax Income (EBT)
- Income Tax
= Net Income
Key income statement concepts:
| Concept | Definition | Why It Matters |
|---|---|---|
| Gross margin | Gross Profit / Revenue | Measures pricing power and production efficiency |
| Operating margin | Operating Income / Revenue | Measures overall business profitability |
| Net margin | Net Income / Revenue | Bottom-line profitability after all costs |
| EBITDA | Earnings before interest, taxes, depreciation, amortization | Cash earnings proxy; widely used in valuation |
The accrual principle:
The income statement records revenue when earned and expenses when incurred, not necessarily when cash changes hands. This is the source of much financial statement complexity:
The accrual principle makes revenue and profit numbers less reliable indicators of economic reality than the cash flow statement. A company can report record profits while running out of cash, as WeWork's failed 2019 IPO filing made painfully clear when it revealed billions in losses masked by "adjusted" metrics.
The Balance Sheet
The balance sheet shows what the company owns (assets) and owes (liabilities) at a specific point in time. It answers: what is the company's financial position?
The fundamental accounting equation:
Assets = Liabilities + Shareholders' EquityThis equation must always balance. Every transaction affects both sides equally.
Balance sheet structure:
Current Assets (convertible to cash within 1 year):
  Cash and Cash Equivalents
  Short-term Investments
  Accounts Receivable
  Inventory
  Prepaid Expenses

Long-term Assets:
  Property, Plant & Equipment (PP&E)
  - Accumulated Depreciation
  = Net PP&E
  Intangible Assets (patents, trademarks)
  Goodwill
  Long-term Investments
Liabilities:
Current Liabilities (due within 1 year):
  Accounts Payable
  Accrued Liabilities
  Short-term Debt
  Deferred Revenue

Long-term Liabilities:
  Long-term Debt
  Deferred Tax Liabilities
  Other Long-term Liabilities
Shareholders' Equity:
Common Stock (par value)
Additional Paid-in Capital
Retained Earnings (accumulated net income minus dividends)
Treasury Stock (shares repurchased, shown as negative)
= Total Shareholders' Equity
Key balance sheet ratios:
| Ratio | Formula | What It Measures |
|---|---|---|
| Current ratio | Current Assets / Current Liabilities | Short-term liquidity |
| Quick ratio | (Cash + Receivables) / Current Liabilities | Immediate liquidity (no inventory) |
| Debt/equity ratio | Total Debt / Shareholders' Equity | Financial leverage |
| Return on equity (ROE) | Net Income / Shareholders' Equity | Profitability per dollar of equity |
| Return on assets (ROA) | Net Income / Total Assets | Profitability per dollar of assets |
The Cash Flow Statement
The cash flow statement shows actual cash movements in and out of the business during a period. It answers: how did cash change, and why?
Cash flow statement structure:
Operating Activities:
  Net Income
  + Depreciation & Amortization (non-cash expense added back)
  + Changes in Working Capital:
    - Increase in Accounts Receivable (used cash)
    + Increase in Accounts Payable (provided cash)
    - Increase in Inventory (used cash)
  = Cash from Operations (CFO)

Investing Activities:
  - Capital Expenditures (purchase of PP&E)
  + Proceeds from Asset Sales
  - Acquisitions
  = Cash from Investing (CFI)

Financing Activities:
  + Debt Borrowed
  - Debt Repaid
  + Stock Issued
  - Stock Repurchased (buybacks)
  - Dividends Paid
  = Cash from Financing (CFF)

Net Change in Cash = CFO + CFI + CFF
Ending Cash = Beginning Cash + Net Change in Cash
Why the cash flow statement matters most:
The cash flow statement is the hardest to manipulate of the three statements. Cash is cash. You either have it or you do not. The income statement can be inflated through accounting choices; the cash flow statement is more constrained.
The most important cash flow metric: Free Cash Flow (FCF)
Free Cash Flow = Cash from Operations - Capital ExpendituresFCF is the cash available to the business after maintaining and growing its asset base: what can actually be paid to investors or reinvested.
| FCF Scenario | Interpretation |
|---|---|
| FCF consistently positive and growing | Healthy, self-funding business |
| FCF positive but declining | Concerning; watch earnings quality |
| FCF negative, high capex | Investing in growth (may be fine for growth companies) |
| FCF negative, low capex | Cash-burning business; may need financing |
| Net income positive, FCF negative | Earnings quality concern; accruals not converting to cash |
Ittelson's Step-by-Step Teaching Method
What makes this book unique is Ittelson's approach: he builds AppleSeed Enterprises, a fictional apple cider company, from scratch. Each business transaction is recorded and its effect on all three financial statements is shown simultaneously.
Example: the first transaction
AppleSeed founders invest $25,000 to start the company.
| Statement | Effect |
|---|---|
| Balance Sheet | Cash +$25,000; Common Stock +$25,000 |
| Income Statement | No effect (receiving investment is not revenue) |
| Cash Flow Statement | Financing Activities: +$25,000 (stock issued) |
Example: selling on credit
AppleSeed sells $10,000 of cider, to be paid in 30 days.
| Statement | Effect |
|---|---|
| Income Statement | Revenue +$10,000; Net Income +$10,000 (approx.) |
| Balance Sheet | Accounts Receivable +$10,000; Retained Earnings +$10,000 |
| Cash Flow Statement | No cash effect yet (operating activities: AR increase is a use of cash) |
By working through 30-plus transactions this way, Ittelson makes the double-entry nature of accounting intuitive rather than abstract. When I worked through the transactions in Chapters 3 through 7, I found myself anticipating the effects before reading the explanations. That is the sign of a teaching method that works.
Reading Real Annual Reports
After building the fictional statements, Ittelson applies the framework to reading actual corporate annual reports. This is where the book transitions from textbook to practical reference.
The 10-K Structure
The 10-K is the annual report public companies file with the SEC. Understanding its structure is essential for any investor who reads financial filings.
| Section | Contents |
|---|---|
| Business description | What the company does; competitive position |
| Risk factors | Specific risks to the business (read for substance, not boilerplate) |
| MD&A (Management Discussion & Analysis) | Management's explanation of financial results |
| Financial statements | The three statements with notes |
| Notes to financial statements | Accounting policies, detail on significant items |
| Auditor's report | Independent auditor's opinion on statement fairness |
What to Focus on in MD&A
MD&A is management's narrated explanation of the financial results. Key elements:
Segment reporting: How is revenue and profit distributed across business units? Is the best-performing segment growing or shrinking?
Liquidity and capital resources: How does management describe their cash position and financing needs? Red flags include vague "adequate for the foreseeable future" language without specifics, or heavy reliance on revolving credit facilities.
Non-GAAP measures: Many companies present "adjusted" earnings that exclude various costs. GAAP requires standardized reporting, but companies increasingly emphasize non-GAAP figures. Examine what is being excluded. Are these genuinely one-time items, or recurring costs being systematically excluded to inflate the "adjusted" number? A 2025 analysis by the SEC's Division of Corporation Finance noted that non-GAAP adjustments have grown steadily, with some companies excluding stock-based compensation (a real economic cost) to make earnings look better.
The Notes to Financial Statements
Notes are the most overlooked and most important section of annual reports for sophisticated readers:
| Note | What to Look For |
|---|---|
| Revenue recognition policy | When and how revenue is recognized; any changes from prior year |
| Inventory accounting method | FIFO vs. LIFO (affects cost of goods sold and profitability) |
| Depreciation policies | Useful lives assumed; changes in estimates |
| Debt schedule | Maturity dates, covenants, interest rates |
| Goodwill | Impairment testing; whether acquisition premiums are justified |
| Related party transactions | Transactions with executives, major shareholders, affiliates |
| Subsequent events | Material events after the balance sheet date |
The Key Financial Ratios for Investors
Ittelson summarizes the most important ratios that connect the three statements. These are the ratios you should calculate when evaluating any stock.
Profitability Ratios
| Ratio | Formula | Strong | Weak |
|---|---|---|---|
| Gross margin | Gross Profit / Revenue | >50% (software, pharma) | <20% (commodities, retail) |
| Operating margin | Operating Income / Revenue | >20% | <5% |
| Net margin | Net Income / Revenue | >15% | <5% |
| Return on equity | Net Income / Avg Equity | >15% | <8% |
| Return on invested capital | NOPAT / Invested Capital | >10% | <WACC (value-destroying) |
Liquidity Ratios
| Ratio | Formula | Strong | Concern |
|---|---|---|---|
| Current ratio | Current Assets / Current Liabilities | >2.0 | <1.0 |
| Quick ratio | (Cash + Receivables) / Current Liabilities | >1.0 | <0.5 |
| Cash ratio | Cash / Current Liabilities | >0.5 | <0.2 |
Efficiency Ratios
| Ratio | Formula | Better Performance |
|---|---|---|
| Asset turnover | Revenue / Total Assets | Higher is better |
| Inventory turnover | COGS / Average Inventory | Higher is better |
| Days Sales Outstanding | (Receivables / Revenue) x 365 | Lower is better |
| Days Inventory Outstanding | (Inventory / COGS) x 365 | Lower is better |
| Days Payable Outstanding | (Payables / COGS) x 365 | Higher is better (longer to pay suppliers) |
The Cash Conversion Cycle:
Cash Conversion Cycle = DSO + DIO - DPOA lower (or negative) Cash Conversion Cycle means the company collects cash from customers before it must pay suppliers. Amazon famously operates with a negative cash conversion cycle, which is one reason it can fund its own growth without external capital.
Leverage Ratios
| Ratio | Formula | Conservative | Aggressive |
|---|---|---|---|
| Debt/equity | Total Debt / Equity | <0.5 | >2.0 |
| Interest coverage | EBIT / Interest Expense | >10x | <2x |
| Debt/EBITDA | Total Debt / EBITDA | <2x | >5x |
Common Investor Errors in Reading Financial Statements
Ittelson highlights frequent misreadings that trip up even experienced investors:
| Error | Reality |
|---|---|
| Confusing profit with cash | Profitable companies can run out of cash if receivables grow too fast |
| Treating goodwill as a real asset | Goodwill is the premium paid in acquisitions; it may or may not represent real value |
| Ignoring off-balance-sheet items | Operating lease commitments, pension obligations, and contingent liabilities are real financial obligations |
| Relying on EPS alone | EPS can be manipulated through share buybacks; always examine FCF per share too |
| Missing accounting method changes | A change in depreciation assumption or revenue recognition can significantly impact comparability |
I made the "confusing profit with cash" mistake early in my investing journey. I bought shares in a company reporting strong revenue growth but negative operating cash flow. The receivables were ballooning because customers were not paying. Within two quarters, the company announced a writedown and the stock dropped 40%. Reading Ittelson's chapter on earnings quality would have saved me that loss.
Practical Applications
Using This Book to Analyze a Real Company
After finishing Financial Statements, I applied the framework to Apple's 2023 10-K filing. Here is what the process looked like:
Step 1: Read the income statement to understand revenue growth and margin trends. Apple's revenue was $383 billion with a 44.1% gross margin and 25.3% net margin. Those are exceptional numbers for a company of that size.
Step 2: Check the cash flow statement to verify earnings quality. Apple generated $113 billion in operating cash flow against $97 billion in net income. Operating cash flow exceeding net income is a positive sign: the business generates more cash than accounting profits suggest.
Step 3: Calculate free cash flow. Apple spent $10.9 billion on capital expenditures, leaving $102.1 billion in free cash flow. That is an extraordinary number and explains why Apple can fund $77 billion in buybacks and $15 billion in dividends annually.
Step 4: Examine the balance sheet for leverage and liquidity. Apple had $162 billion in cash and marketable securities against $98 billion in debt. Net cash position of $64 billion.
Step 5: Read the notes. Apple's revenue recognition policy, warranty obligations, and tax arrangements all appear in the notes. The notes on deferred revenue ($8 billion) revealed how much future service revenue Apple had already collected.
This five-step process takes about 30 minutes once you understand the statements. Use our investment return calculator to model how different growth rates and margins would affect a company's future cash flow.
Building Your Own Financial Statements
If you run a small business or side hustle, Ittelson's transaction-by-transaction method is directly applicable. Track every transaction through all three statements from day one. Most small business owners only look at their bank balance. That tells you whether you have cash today, but not whether your business model is sustainable. The income statement tells you whether you are profitable. The balance sheet tells you whether you are solvent. The cash flow statement tells you whether you can pay your bills next month. All three matter.
Strengths & Weaknesses
What We Loved
Areas for Improvement
Who Should Read This Book
Highly Recommended For
Probably Not For
Comparison to Similar Books
| Book | Approach | Difficulty | Best For |
|---|---|---|---|
| Financial Statements (Ittelson) | Transaction-by-transaction visual method | Beginner | Non-accountants who want intuition |
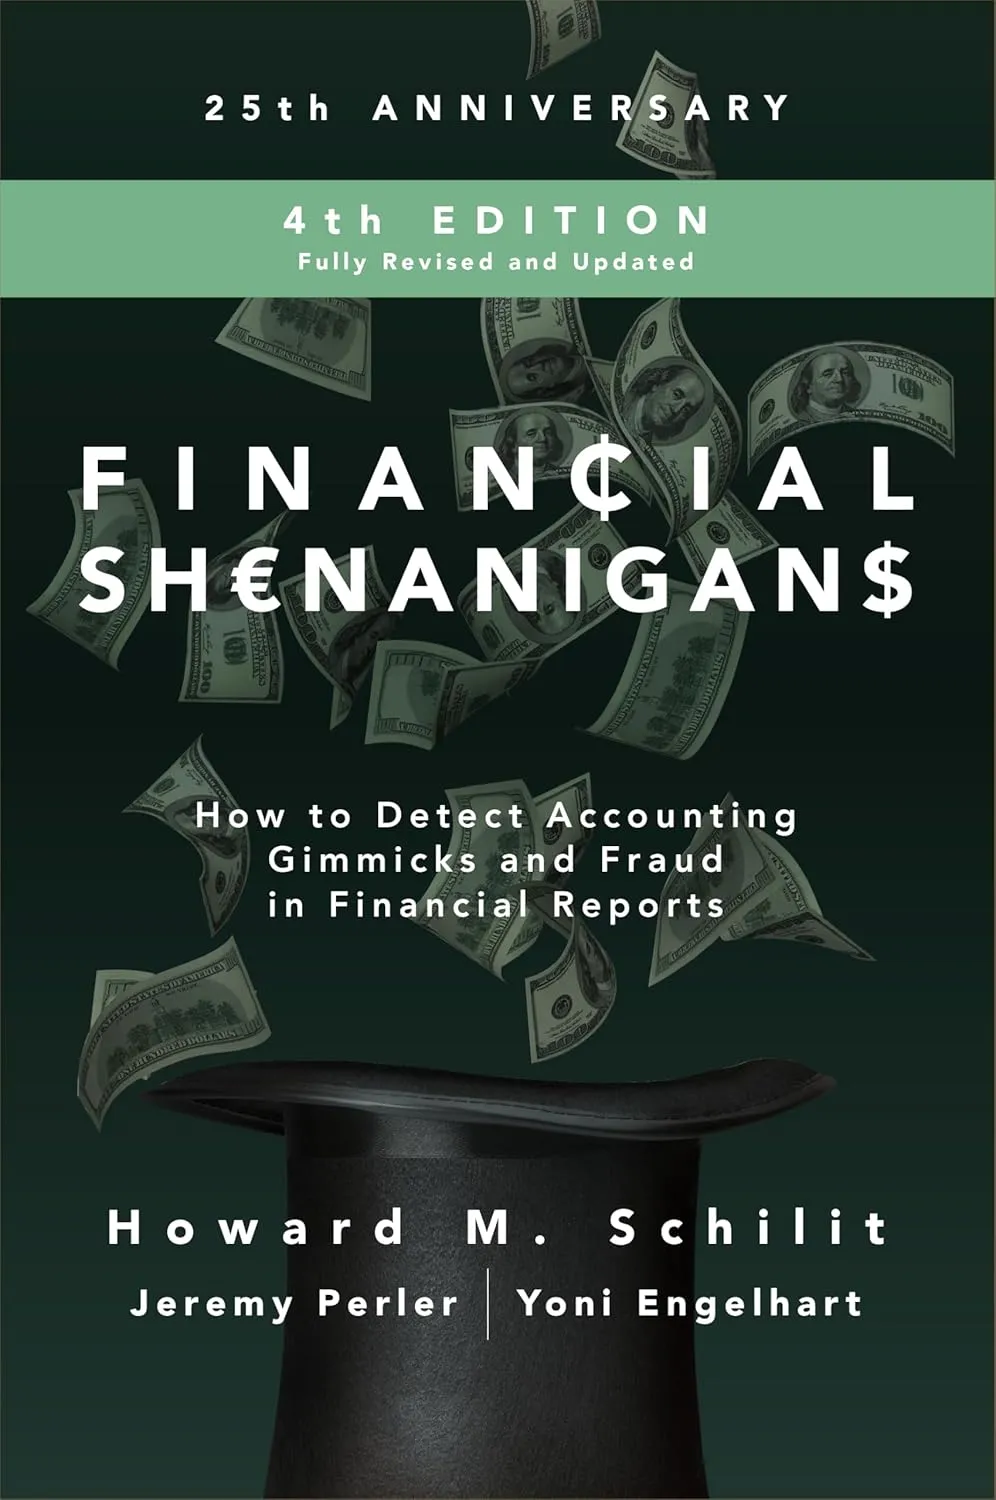
| Financial Shenanigans (Schilit) | Forensic accounting and fraud detection | Intermediate | Investors wanting to spot manipulation |
| The Little Book of Valuation (Damodaran) | Valuation methods and models | Intermediate | Investors building DCF models |
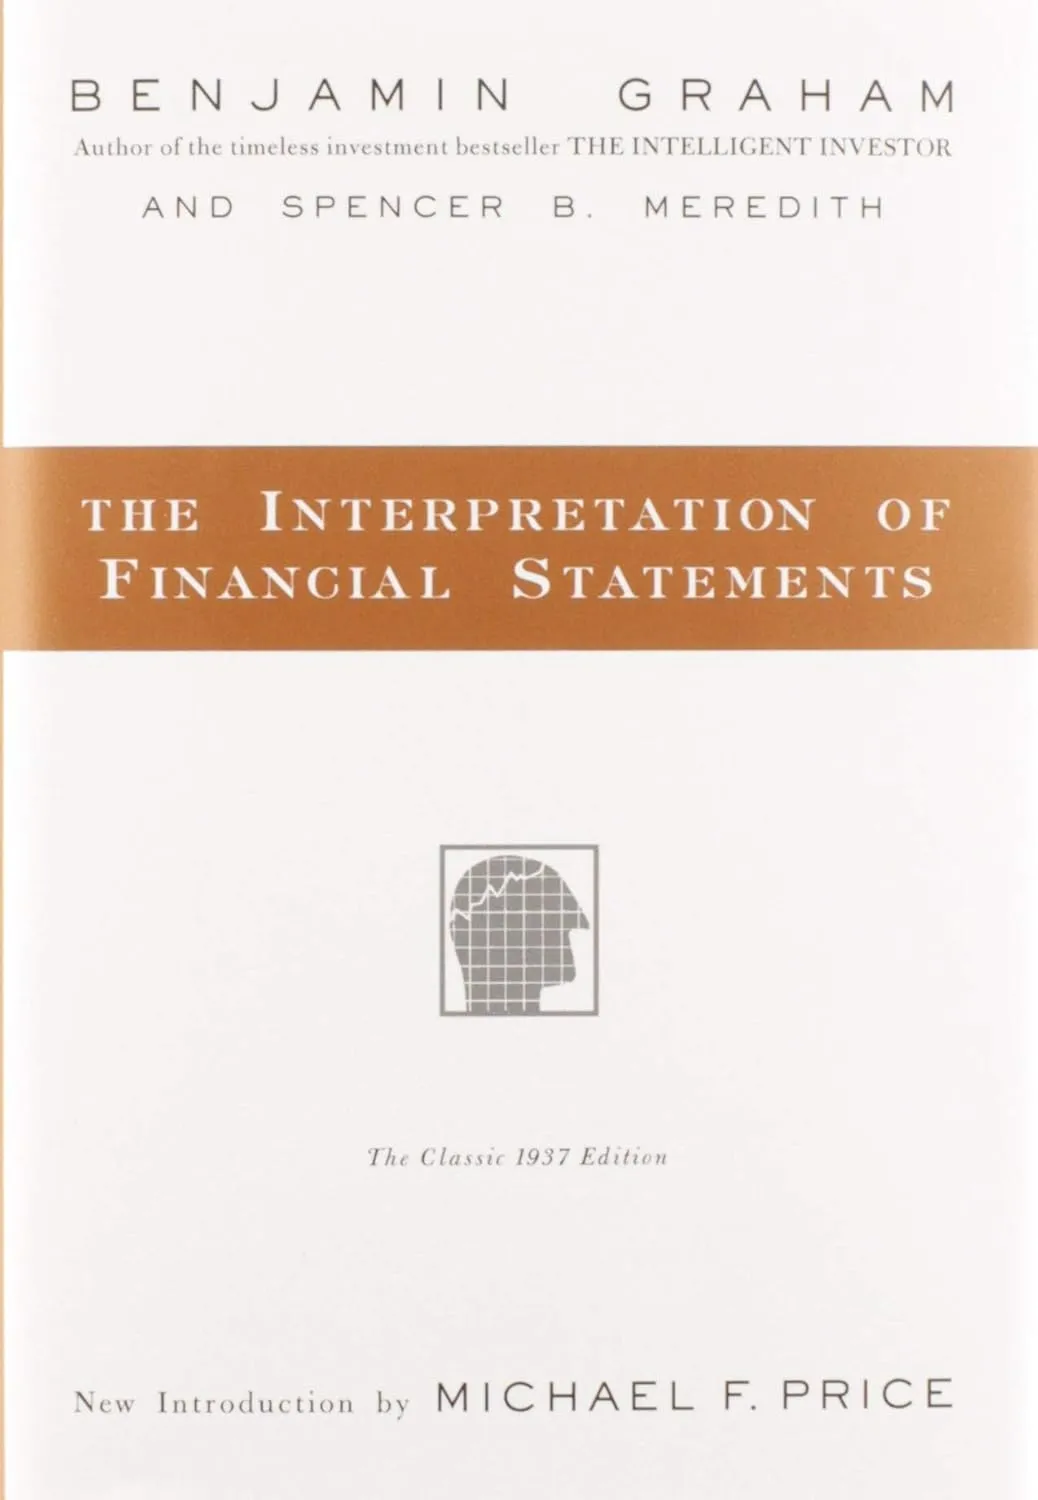
| Security Analysis (Graham) | Classic deep value analysis | Advanced | Professional analysts |
Read Ittelson first, then Schilit, then Damodaran. Each builds on the previous one.
Implementation Guide
30-Day Study Plan
Week 1: Foundation
Week 2: Cash Flow and Connection
Week 3: Analysis
Week 4: Application
Action Steps
Frequently Asked Questions
Q: Do I need any prior accounting knowledge?
A: None. Ittelson genuinely starts from scratch and the step-by-step transaction approach requires no background. The first chapter explains basic concepts like what a balance sheet is before building anything complex.
Q: Should I read this before Financial Shenanigans?
A: Yes. Financial Shenanigans assumes you can read the statements; Ittelson teaches you how. Read this first, then Schilit.
Q: Is the 2022 edition worth buying if I have an older copy?
A: If you have the 2009 revised edition, the core content is similar. The 2022 edition adds nonprofit accounting and pricing-for-profitability sections, plus updated terminology. If you are buying fresh, get the 2022 edition. If you already own the 2009 version, you can skip the upgrade unless you need the nonprofit material.
Q: Can I use this book to analyze bank stocks?
A: Partially. The three-statement framework applies, but banks have unique balance sheet structures (loans as assets, deposits as liabilities) and regulatory capital requirements that Ittelson does not cover. Start here for the foundation, then look for a bank-specific resource.
Final Verdict
Rating: 4.7/5
Financial Statements remains the single best introduction to accounting for non-accountants. The 2022 edition keeps the transaction-by-transaction teaching method that makes the book effective, adds useful new sections, and sells for under $20. Every investor who reads annual reports should start here.
If you want to understand what companies are actually doing with their money, this book gives you the tools. You will read 10-K filings differently after finishing it, and you will spot things that most retail investors miss entirely.
Get Your Copy
Paperback: Buy on Amazon
Kindle: Buy on Amazon
Prices current as of publication date. Free shipping available with Prime.